Trend Mobile
- Indicatori
- Yvan Musatov
- Versione: 1.0
- Attivazioni: 5
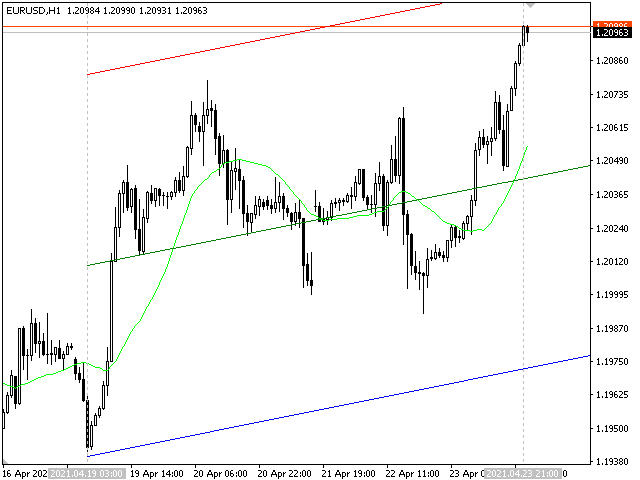
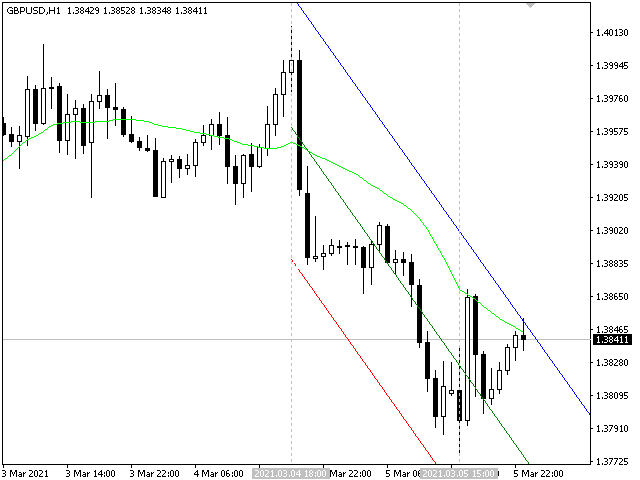
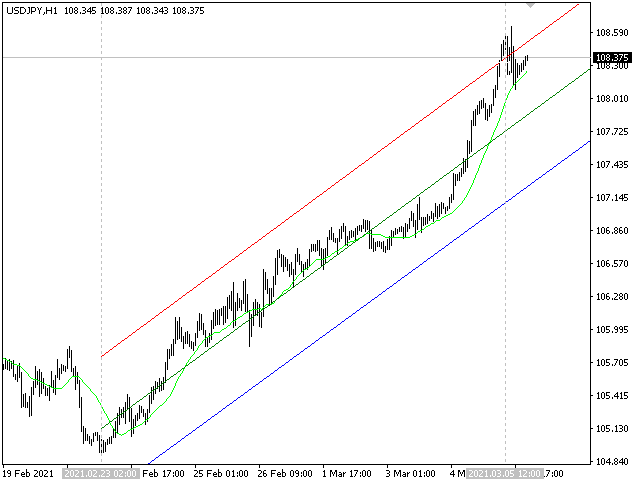
The regression channel is one of the most popular technical analysis tools among traders. First, the indicator draws a trend line between two points, then on its basis it builds a channel of two parallel lines, which will be at the same distance from the regression line.
The term linear regression belongs to the field of statistics. The center line of the channel is the trend line. To calculate it, the least squares method is used. The line above the center line acts as resistance for the price and represents nothing more than the maximum deviation of the closing price from the average value, which is represented by the trend line in the channel. Below is the support level. The basis for its calculation is the deviation of the minimum price from the average.
It is believed that the price of a currency pair should be within the range of the linear regression channel. This situation is typical for a trend movement, which can be determined using the channel slope angle. If the price goes beyond the indicated corridor, this means a possible quick change in the trend, after which the inclined lines will change direction. The distance from the regression line to the channel line depends on the magnitude of the maximum deviation of the closing price from the middle line. If the price reaches the channel border or, even better, crosses it, then wait for a trend reversal.


