• Panoramica
  • Recensioni (7)
  • Commenti (4)
  • Novità

VR Pivot MT5

VR Pivot is an indicator of key pivot points.

Pivot points are a special type of support and resistance levels that are used to determine the strongest price zones. Professional traders use pivot levels to determine prices at which there is a high probability of a price reversal. The levels are calculated using special mathematical formulas, which include the closing, opening, high, and low prices of the previous time period. The most effective is the daily period. It is important to note that at first glance it may seem that there is nothing special about these levels, but if you analyze the price movement using pivot levels, you can clearly see that in most cases these levels show good, accurate results.

You can request technical support, settings and demo versions of programs in the author's profile.

Pivot levels can be used not only as pivot points, but also as levels at which Take Profit can be used as efficiently as possible to maximize profit, Stop Loss to minimize losses as much as possible, and transfer positions to a no-loss zone to reduce risks.

Advantages of the VR Pivot Indicator:

  • The indicator supports the calculation of several formulas:
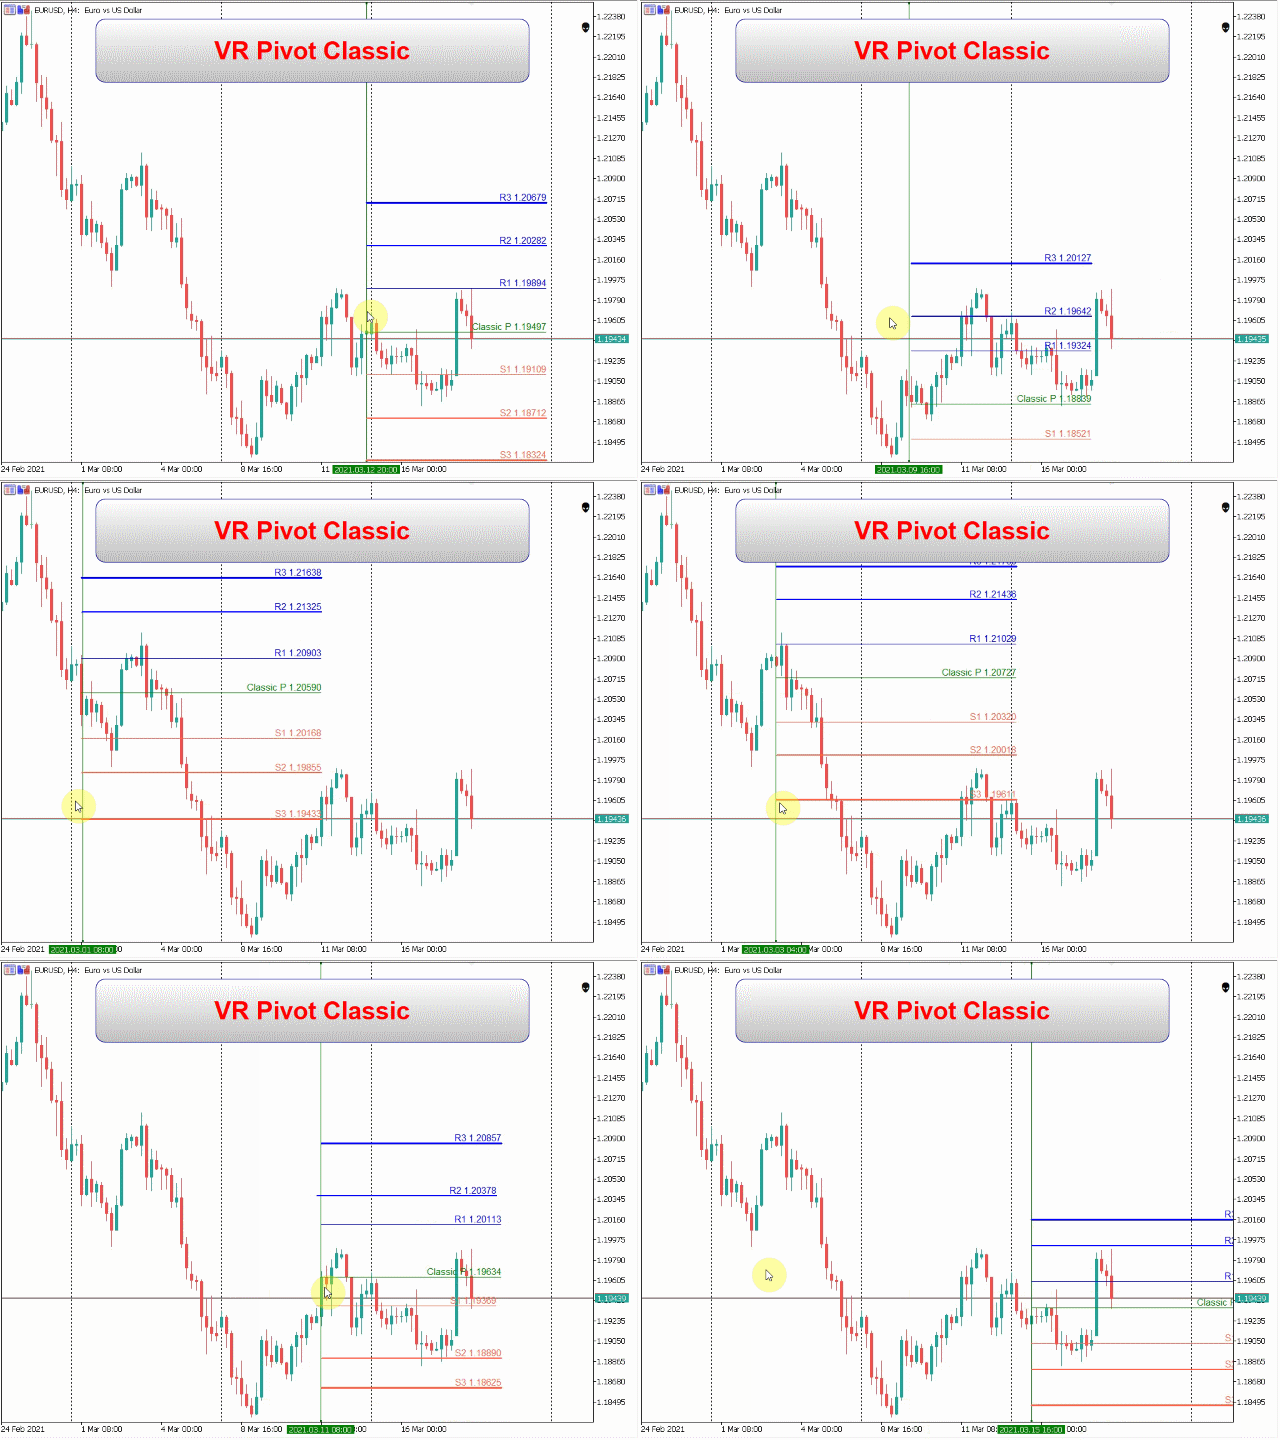
    • Classic Pivot - the classic formula for pivot points
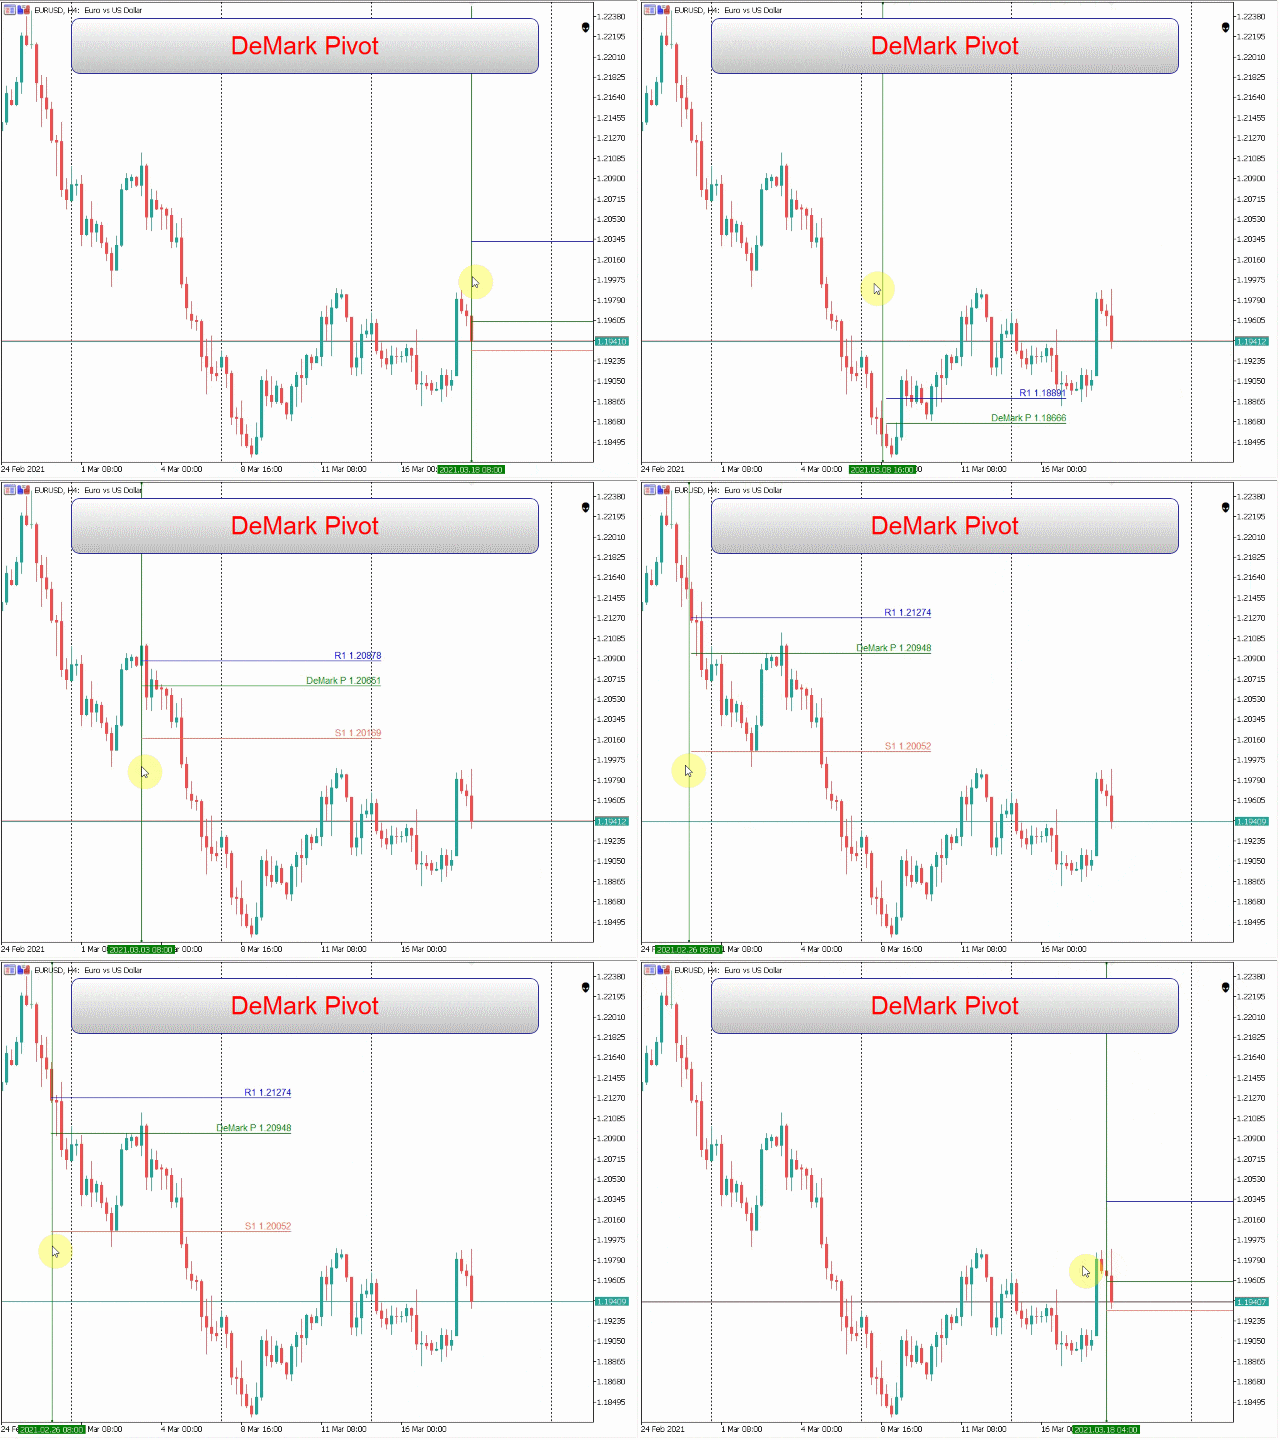
    • DeMark Pivot - DeMark formula
    • Woodie Pivot - Woodie Formula
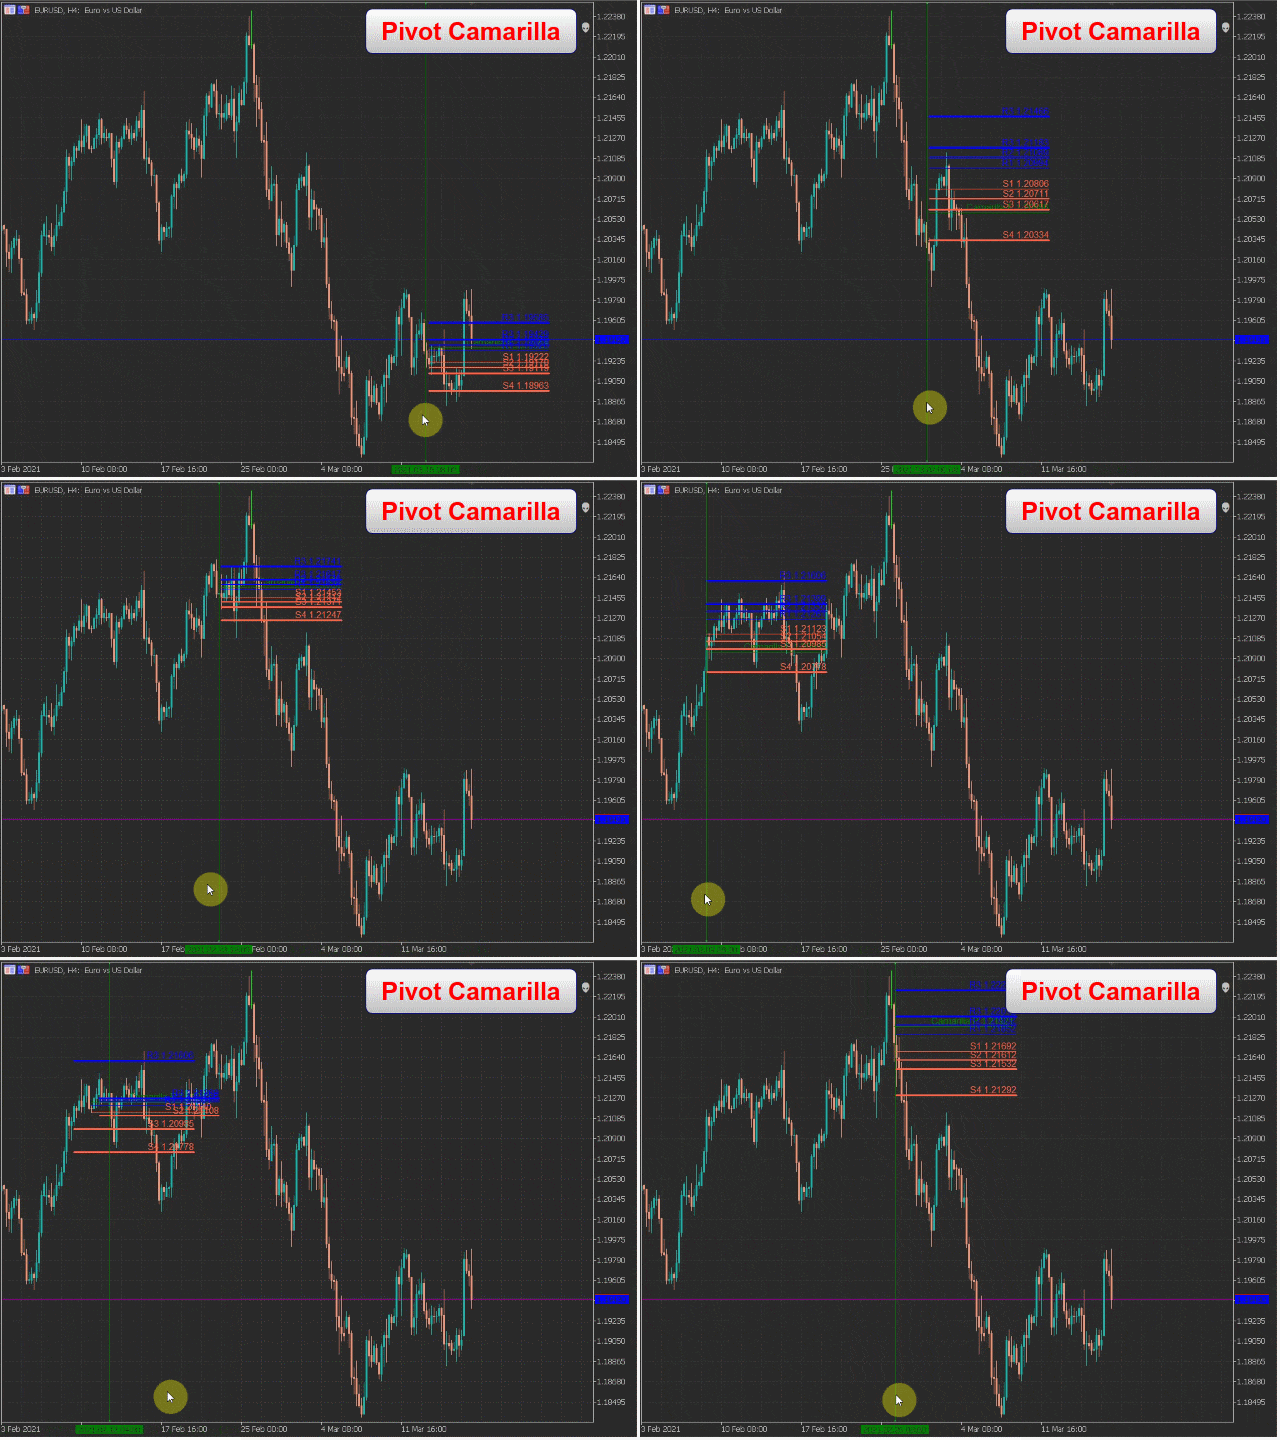
    • Camarilla Pivot - Camarilla Formula
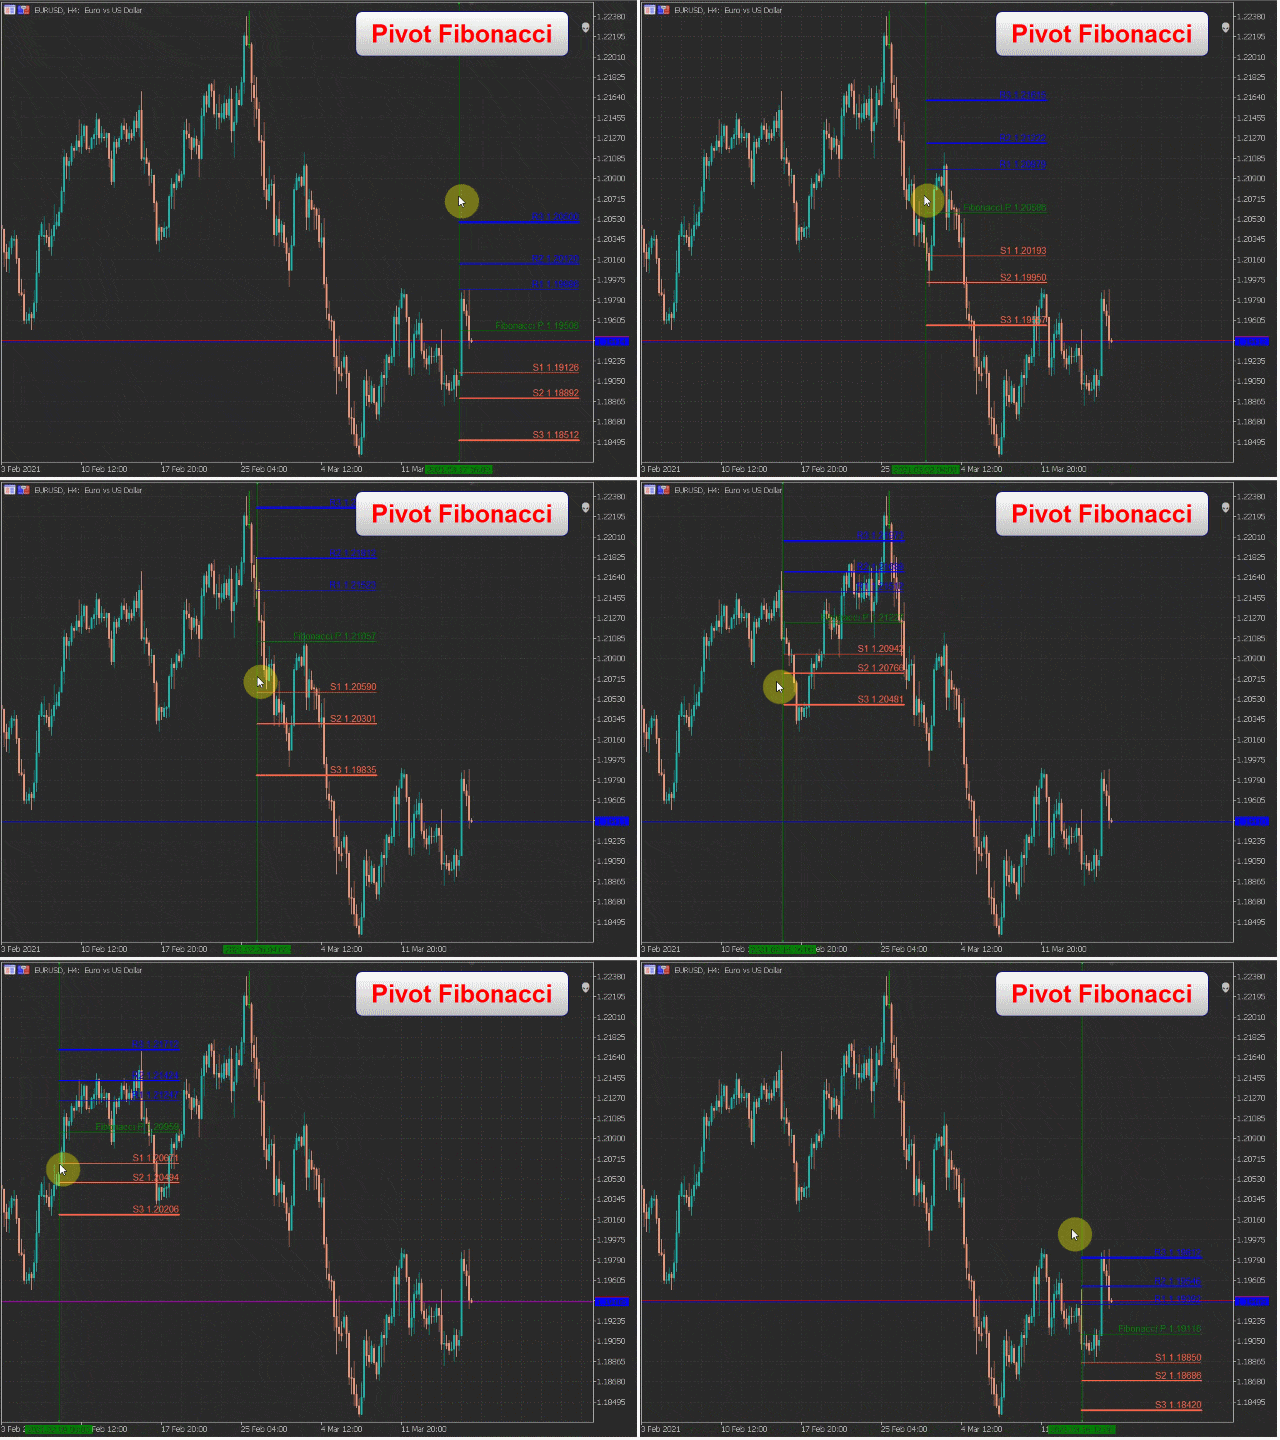
    • Fibonacci Pivot - Fibonacci Formula
  • The program is implemented as an indicator and can work together with your Expert Advisors and other indicators
  • It is possible to analyze historical data
  • The program is written in such a way that it displays information for the period set by the user and does not clutter the chart with historical data.
  • The indicator can calculate losses for any financial instruments (Forex, Crypto, CFD, Futures, Metals)
  • The trader can choose any time frames for the calculation
  • The indicator has a large number of settings that allows you to customize it in any style

Indicator operation algorithm

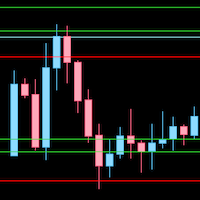
After you drag the indicator from the navigator to the chart, you will see a settings window where you can select the calculation formula and adjust the colors of the levels. After you click the "Ok" button, the chart will display horizontal levels and one vertical level. Using the vertical level, the trader can move the starting point of the calculations. Use the vertical level to study the historical data. To calculate new key levels, move the vertical level to the current period.

Indicator Settings

  • Main settings - main indicator settings
  • Type Pivot - type of pivots
    • Classic Pivot - the classic formula for pivot points
    • DeMark Pivot - DeMark formula
    • Woodie Pivot - Woodie Formula
    • Camarilla Pivot - Camarilla Formula
    • Fibonacci Pivot - Fibonacci Formula
  • Length of lines - the length of horizontal levels in bars
  • Show Price - display prices on levels
  • Time Frame - The period for calculating the levels, must be greater than the period for which the indicator is set
  • Prefix - prefix for indicator objects
  • Color settings - indicator color settings
Versions for MetaTrader 5 Versions for MetaTrader 4
Prodotti consigliati
My Pivot Pro
Ashok Kumar Singha
My Pivot Pro is the Pro Version of the Indicator " My PIVOT " ( Link:  https://www.mql5.com/en/market/product/90336 ) This indicator will help you a lot to decide the Market Range and Movement.  This Indicator is based on Pivot Lines and Support-Resistance zones. Now we can Plot Standard/Classic; Fibonacci; Demark; Camarilla nd Woodies Pivot Levels as per our requirements. Steps to Setup the Indicator: Install the Custom Indicator; Set the Pivot Type; Period and Time ( We recommend to use
KT Auto Trendline MT5
KEENBASE SOFTWARE SOLUTIONS
KT Auto Trendline draws the upper and lower trendlines automatically using the last two significant swing highs/lows. Trendline anchor points are found by plotting the ZigZag over X number of bars. Features No guesswork requires. It instantly draws the notable trendlines without any uncertainty. Each trendline is extended with its corresponding rays, which helps determine the area of breakout/reversal. It can draw two separate upper and lower trendlines simultaneously. It works on all timefr
BTFX Pivot Points
Bradley Thomas Farrington
The BTFX Pivot Points is an indicator which calculates the Support and Resistance levels for each day. By using this indicator the pivot levels point out clear targets to aim for. The resistance levels are shown in purple above the silver pivot line. The support levels are shown in Orange and can be found below the silver pivot line. This indicators works very well when used with The BTFX Daybreak Indicator. For a more in depth explanation of these indicators please watch the Youtube video attac
Key level wedge MT5
Presley Annais Tatenda Meck
The   Key level wedge MT5   indicator automatically draws rising wedge pattern and falling wedge pattern for you on the chart. This pattern is really good when used as a confirmation entry at key support & resistance, supply & demand and reversal zones. Advantages  The   Key level wedge MT5   block DOES NOT RE-PAINT, giving you confidence when a signal appears and also helps when looking back.  The   Key level wedge MT5   includes an on/off button on the chart to easily keep the charts cle
Weis Wave Double Side
Eduardo Da Costa Custodio Santos
L'indicatore laterale Weis Wave Bouble per MT5 fa parte del toolkit (Wyckoff Academy Wave Market) L'indicatore laterale Weis Wave Bouble per MT5 è stato creato sulla base della già consolidata Weis Wave creata da David Weis. L'indicatore Weis Wave Double Side legge il mercato a ondate come è stato fatto da R. Wyckoff nel 1900. Aiuta a identificare sforzo x risultato, causa ed effetto e domanda e offerta Il suo differenziale è che può essere utilizzato sotto l'asse zero, migliorando ulteriormente
The utility draws pivot levels for the selected timefram in classic method. Pivot = (high + close + low) / 3 R1 = ( 2 * Pivot) - low S1 = ( 2 * Pivot) - high R2 = Pivot + ( high - low ) R3 = high + ( 2 * (Pivot - low)) S2 = Pivot - (high - low) S3 = low - ( 2 * (high - Pivot)) you can change the timeframe, colors and fontsize. also you can change the text for the levels. Have fun and give feedback...
FREE
Swiss VWAPsimple
Terence Gronowski
5 (4)
Swiss VWAPsimple Motivation Did not find free VWAP that works, the one that I found craseh. So I created a VWAP which calculates values only for the actual day. So computer resouces are not over stressed. What is VWAP, how is it used?  VWAP stands for Volume Weighed Average Price, it calculates the running sum of tick volume and the runnung sum of price times tickvolume. The division of these sums result in a weighed price (Sum P*V/Sum V). The calculation starts normally at midnight. The value
FREE
This indicator is stand alone version from  MP Pivot Levels  (All in one) containing Demark's Pivots. Calculations:     PP = X / 4     R1 = X / 2 - LOWprev     S1 = X / 2 - HIGHprev Uses: When the pair currency price may change the direction of movement. Possible constraints of support and resistance that creates plateaus for the currency pair prices. Tendency identification by comparing the present prices according to current day's pivot point and also the prior day's pivot points. ___________
FREE
Fractal Levels based on Higher Timeframe è un potente strumento progettato per costruire accurati livelli di supporto e resistenza basati sui frattali del timeframe superiore, che fornisce segnali di acquisto e vendita con comodi avvisi. Come funziona: l'indicatore analizza i livelli frattali sul timeframe superiore e li visualizza sul grafico corrente. È possibile regolare facilmente il timeframe superiore nelle proprietà dell'indicatore per ottenere la massima precisione e rilevanza per le
Midas is the acronym for Market Interpretation / Data Analysis System is a trade approach started in 1995 by technical analyst Paul Levine and later developed by Andrew Coles, PhD and David Hawkins. Learn more in the book MIDAS Technical Analysis: A VWAP Approach to Trading and Investing in Today's Markets , (I saw that it is possible buy via Amazon). The positive points in relation to the Midas-based indicators are the prediction of movement reversal points, the negative point is the subjectivi
Big Players
Cesar Afif rezende Oaquim
Nade com os grandes ou evite-os a todo custo. Com esse indicador, a escolha é sua! Indicador por coloração de barras, com respostas simples se os "grandes" estão negociando ou não. Saiba quando agir se o mercado está calmo ou agitado, de forma simples, pelo valor de retorno do indicador ou pela aparência das barras. Indispensável indicador para a construção do seu robô ou para seu setup. Resultado do Indicador: 0 - 5. Participantes do mercado: 0 e 1 = Big Players! 2 e 3 = Dia normal. 4 e 5 = M
AliPivot Points is a Meta Trader 5 Indicator that draws you the latest pivot points. You can choose from timeframes ranging from 1 Minute to 1 Month. Calculation methods for pivot points includes: Classic Pivot Points Camarilla Pivot Points Fibonacci Pivot Points Woodie Pivot Points You can personalize the line colors, style, and width to suit your preference. The indicator displays values on the right side of the chart. AliPivot Points values can also be utilized by developers for creating Expe
FREE
Pivots Lines
Abakou Nazaire Ayelenou
Disegna i punti pivot Traditionnal, Fibonacci, Woodie, Classic, Demark, Camarilla per qualsiasi timeframe Supporta tutti i tipi di pivot Traditionnal, Fibonacci, Woodie, Classic, Demark, Camarilla Supporta qualsiasi timeframe (M1...H1...D1...MN1...Annuale) Supporto server ora legale Supporta la sezione giornaliera del forex dall'apertura di Sydney alla chiusura degli Stati Uniti Supporta il trading di criptovalute Riempi il divario tra il pivot e la tendenza, molto utile I punti pivot mostr
Support and Resistance Malaysian   è un indicatore personalizzato progettato per visualizzare i livelli di supporto e resistenza su un grafico. Questi livelli si basano sulla teoria del supporto e della resistenza malese, che definisce i livelli non come aree, ma come specifici livelli di prezzo derivati dai picchi e dai valli del grafico a linee. Caratteristiche: Tre tipi di livelli: A-Level, V-Level e Gap Level. Indicazione di freschezza per i livelli: i livelli freschi sono più significativi
WAPV Weis Wave Chart Forex
Eduardo Da Costa Custodio Santos
Il Weis Wave Chart Forex per MT5 è un indicatore di prezzo e volume. La lettura del prezzo e del volume è stata ampiamente diffusa tramite Richard Demille Wyckoff sulla base delle tre leggi da lui create: offerta e domanda, causa ed effetto e sforzo contro risultato. Già nel 1900 R.Wyckoff utilizzava la carta delle onde nelle sue analisi. Molti anni dopo, intorno al 1990, David Weis ha automatizzato il diagramma delle onde di R. Wyckoff e oggi vi portiamo l'evoluzione del diagramma delle onde di
AutomaticZigZag
Stanislav Korotky
4.67 (3)
This is a non-parametric ZigZag providing 4 different methods of calculation. Upward edge continues on new bars while their `highs` are above highest `low` among previous bars, downward edge continues on next bars while their `lows` are below lowest `high` among previous; Gann swing: upward edge continues while `highs` and `lows` are higher than on the left adjacent bar, downward edge continues while `highs` and `lows` are lower than on the left adjacent bar. Inside bars (with lower `high` and
FREE
Horizontal Level indicator - reflects, using a histogram, the horizontal volumes of transactions at a certain price without reference to time. At the same time, the histogram appears directly in the terminal window, and each column of the volume is easily correlated with the quote value of the currency pair. The volume of transactions is of great importance in exchange trading, usually an increase in the number of concluded contracts confirms the trend, and their reduction indicates an imminent
Pivot Points MT5 is a universal color multicurrency/multisymbol indicator of the Pivot Points levels systems. You can select one of its three versions: Standard Old, Standard New and Fibo . It plots pivot levels for financial instruments in a separate window . The system will automatically calculate the Pivot Point on the basis of market data for the previous day ( PERIOD_D1 ) and the system of support and resistance levels, three in each. A user can choose colors for the indicator lines. The on
The   Pivot Point indicator   automatically calculates and displays the pivot point line and support and resistance levels. Pivot can be calculated according to the Classic, Floor, Fibonacci, Woodie, Camarilla or DeMark formula. It is also possible to select the period for calculating the indicator. A trader can choose from daily, weekly, monthly, or user-defined periods. Types of pivots Classic Floor Fibonacci Woodie Camarilla DeMark Main features The indicator shows the current and histor
FREE
Draw levels of support and resistance based on highs/lows or closes from daily, weekly or monthly. This indicator uses the highs, lows or closes to draw horizontal lines on the graph. By observing those lines you can identify trend (gaining or losing levels of resistence/support) and find good levels where price can bounce. For those who trade price action, this is a very useful indicator.
White Weis Volume Ticks
Ricardo Almeida Branco
5 (3)
White Weis Volume This indicator shows the sum of the volume in each wave, bulish or bearish, as idealized by David Weis , but it brings an important addition , which is the marking of the bar with the highest volume of the wave (White Bar)! In coding the indicator, it was sought to optimize the code to require minimal processing during use and not to overload mt5. The indicator can be used for pre-trading analysis and study, where the trader analyzes possible points of support and resi
This z-score indicator shows the correct z-score of an asset, as it uses the normalized price data for calculation, which is the only correct way. Z-score is only applicable for normal distributed data, therefore not the actual price is considered, but the normalised returns, which were assumed to follow a normal distribution. Returns are mean reverting and assumed to follow a normal distribution, therefore z-score calculation of returns is more reliable than z-score on price, as price is NOT m
HiqIndi
Ratul Goswami
It is 1 Minute Strategy. When Indicator Gives Signal Then Put on Buy. It's Best Work on Crash 300 & Crash 500. If you want to know anything details please Contact Me on Telegram In this Link:  https://t.me/+mi_52VwFp3E4MGNl It is very nice for scalping & for who not gives enough time on market. N/B: Please be carefully it's only for scalping & not trade all the day. It's only 10 or maximum 15 trade per day. Thanks everyone.
DailySessions
Davide Zunino
4.71 (7)
L'indicatore rappresenta i box di sessione per le sessioni Asiatica, Europea e Americana. E' possibile modificare gli orari di ogni sessione, come il colore. E' anche possibile disabilitare a piacimento la visualizzazione di ogni sessione. Trovate nei parametri di input Tab Dati in ingresso le variabili da modificare in formato hh:mm, nel tab Colori i colori da modificare per ogni box.
FREE
Weis Wave Double Side Alert
Eduardo Da Costa Custodio Santos
L'indicatore laterale Weis Wave Bouble per MT5 fa parte del toolkit (Wyckoff Academy Wave Market) L'indicatore laterale Weis Wave Bouble per MT5 è stato creato sulla base della già consolidata Weis Wave creata da David Weis. L'indicatore Weis Wave Double Side legge il mercato a ondate come fece R. Wyckoff nel 1900. Aiuta a identificare sforzo x risultato, causa ed effetto e domanda e offerta Il suo differenziale è che può essere utilizzato sotto l'asse zero e mostra un avviso di breakout Chi è f
Vwap Freeze
Ricardo Almeida Branco
5 (1)
The previous day's vwap is used by some traders as a support and resistance point, after all it is one of the ways to consider the fair price of that asset or that pair the day before. Possible defenses can occur in this region indicating a reversal, or triggering stops starting a new, more directional movement. It is a matter of analyzing how it will add to your operational. To avoid manually drawing the previous day's vwaps and saving time for your analysis, use the Vwap Freeze indicator,
ArcTracer
Syed Oarasul Islam
This Indicator draws Fibonacci Arc levels in two different ways. You can select whether to draw Fibonacci Arc levels based on your favourite ZigZag settings or you can let the indicator to draw Arc levels based on given number of bars or candles.  You can also set Mobile and Email notification for your favourite Arc levels individually. With this indicator you will not have to feel lonely as the it can generate Voice alerts, which will keep you focused on your trading and remove boredom.  Produc
Channel Vertex is a price action pattern formed by price Chanel and a triangle pattern . Price channels basically indicates possible support and resistance zones around a price movement and retracement    or breakout at these levels can indicate possible trend continuation or reversal .  Majority of the times price fluctuations forms triangle patterns defined by 3 vertexes , these triangle patterns most times defines a trend continuation.  A triangle pattern is a trend continuation pattern tha
The   ICT Unicorn Model   indicator highlights the presence of "unicorn" patterns on the user's chart which is derived from the lectures of   "The Inner Circle Trader" (ICT) . Detected patterns are followed by targets with a distance controlled by the user.   USAGE (image 2) At its core, the ICT Unicorn Model relies on two popular concepts, Fair Value Gaps and Breaker Blocks. This combination highlights a future area of support/resistance. A   Bullish Unicorn Pattern   consists ou
Automatic Fibonacci  is an indicator for automatic Fibonacci Levels drawing. It is fully customizable by user. User can also select different Fibobonacci Levels by user settings or can use multiple Automatic Fibonacci indicator in one chart. All details can be found >>HERE<< Instructions Move Indicator to the chart (simply drag and drop) When pop up window appears select desired settings. Confirm settings and enjoy the Automatic Fibonacci indicator. Features Any chart Any time-frame C
Gli utenti di questo prodotto hanno anche acquistato
Atomic Analyst MT5
Issam Kassas
4.6 (20)
Innanzitutto, vale la pena sottolineare che questo indicatore di trading non è repaint, non è ridisegno e non presenta ritardi, il che lo rende ideale sia per il trading manuale che per quello automatico. Manuale utente: impostazioni, input e strategia. L'Analista Atomico è un indicatore di azione del prezzo PA che utilizza la forza e il momentum del prezzo per trovare un miglior vantaggio sul mercato. Dotato di filtri avanzati che aiutano a rimuovere rumori e segnali falsi, e aumentare il pote
Innanzitutto è importante sottolineare che questo sistema di trading è un indicatore Non-Repainting, Non-Redrawing e Non-Lagging, il che lo rende ideale sia per il trading manuale che per quello automatico. Corso online, manuale e download di preset. Il "Sistema di Trading Smart Trend MT5" è una soluzione completa pensata sia per i trader principianti che per quelli esperti. Combina oltre 10 indicatori premium e offre più di 7 robuste strategie di trading, rendendolo una scelta versatile per div
TPSpro RFI Levels MT5
Roman Podpora
4.67 (9)
Inverti il primo livello di impulso (RFI)       istruire       Russia       -        ESP   Raccomandazione di utilizzare   l'indicatore -   TPSpro   Trend Edizione Professional -Versione   MT5 La cosa più importante nel comercio son è la cosa più importante in futuro. La cosa più importante è la cosa più importante. Funzioni principali: La maggior parte delle zone sono attivate da venditori e compradores! Indicador mostra tutti i livelli/zone dei primi impulsi corretti per acquisti e vendite. LO
TPSproTREND PrO MT5
Roman Podpora
4.89 (9)
TPSpro TREND PRO   è un indicatore di tendenza che analizza automaticamente il mercato, fornisce informazioni sulla tendenza e sui rispettivi cambiamenti e fornisce segnali per entrare nelle operazioni senza ridisegnare. L'indicatore utilizza ciascuna candela e la analizza separatamente. Si riferisce a vari shock al rialzo o al ribasso. Punto di ingresso preciso per il trading di valute, criptovalute, metalli, azioni e indici! Versione MT5                   Descrizione completa dell'indicatore
Gold Stuff mt5
Vasiliy Strukov
4.9 (185)
Gold Stuff mt5 è un indicatore di tendenza progettato specificamente per l'oro e può essere utilizzato anche su qualsiasi strumento finanziario. L'indicatore non ridisegna e non è in ritardo. Periodo consigliato H1. Contattami subito dopo l'acquisto per avere le impostazioni e un bonus personale!   I risultati in tempo reale possono essere visualizzati qui.  Puoi ottenere una copia gratuita del nostro indicatore Strong Support e Trend Scanner, per favore scrivi in ​​privato. M   IMPOSTAZION
Quantum Trend Sniper
Bogdan Ion Puscasu
4.92 (48)
Presentazione       Quantum Trend Sniper Indicator   , l'innovativo indicatore MQL5 che sta trasformando il modo in cui identifichi e scambi le inversioni di tendenza! Sviluppato da un team di trader esperti con un'esperienza di trading di oltre 13 anni,       Indicatore Quantum Trend Sniper       è progettato per spingere il tuo viaggio di trading verso nuove vette con il suo modo innovativo di identificare le inversioni di tendenza con una precisione estremamente elevata. *** Acquista Quant
Top indicator for MT5   providing accurate signals to enter a trade without repainting! It can be applied to any financial assets:   forex, cryptocurrencies, metals, stocks, indices .  Watch  the video  (6:22) with an example of processing only one signal that paid off the indicator! MT4 version is here It will provide pretty accurate trading signals and tell you when it's best to open a trade and close it. Most traders improve their trading results during the first trading week with the help of
Trend Screener Pro MT5
STE S.S.COMPANY
4.88 (67)
Indicatore di tendenza, soluzione unica rivoluzionaria per il trading di tendenze e il filtraggio con tutte le importanti funzionalità di tendenza integrate in un unico strumento! È un indicatore multi-timeframe e multi-valuta al 100% non ridipingibile che può essere utilizzato su tutti i simboli/strumenti: forex, materie prime, criptovalute, indici e azioni. Trend Screener è un indicatore di tendenza che segue un indicatore efficiente che fornisce segnali di tendenza a freccia con punti nel gra
FX Power MT5 NG
Daniel Stein
5 (6)
Ricevi il tuo aggiornamento quotidiano sul mercato con dettagli e schermate tramite il nostro Morning Briefing qui su mql5 e su Telegram ! FX Power MT5 NG è la nuova generazione del nostro popolare misuratore di forza delle valute, FX Power. Cosa offre questo misuratore di forza di nuova generazione? Tutto ciò che avete amato dell'FX Power originale IN PIÙ Analisi della forza di ORO/XAU Risultati di calcolo ancora più precisi Periodi di analisi configurabili individualmente Limite di calcolo pe
Innanzitutto, vale la pena sottolineare che questo Strumento di Trading è un Indicatore Non-Ridipingente, Non-Ridisegnante e Non-Laggante, il che lo rende ideale per il trading professionale. Corso online, manuale utente e demo. L'Indicatore Smart Price Action Concepts è uno strumento molto potente sia per i nuovi che per i trader esperti. Racchiude più di 20 utili indicatori in uno solo, combinando idee di trading avanzate come l'Analisi del Trader del Circolo Interno e le Strategie di Trad
FX Volume MT5
Daniel Stein
4.94 (17)
Ricevi il tuo aggiornamento quotidiano sul mercato con dettagli e schermate tramite il nostro Morning Briefing qui su mql5 e su Telegram ! FX Volume è il PRIMO e UNICO indicatore di volume che fornisce una visione REALE del sentiment del mercato dal punto di vista del broker. Fornisce informazioni straordinarie su come gli operatori di mercato istituzionali, come i broker, sono posizionati sul mercato Forex, molto più velocemente dei rapporti COT. Vedere queste informazioni direttamente sul vo
Easy By Sell is a market indicator for opening and closing positions. It becomes easy to track market entries with alerts. It indicates trend reversal points when a price reaches extreme values ​​and the most favorable time to enter the market. it is as effective as a Fibonacci to find a level but it uses different tools such as an algorithm based on ATR indicators and Stochastic Oscillator. You can modify these two parameters as you wish to adapt the settings to the desired period. My othe
IX Power MT5
Daniel Stein
4.17 (6)
IX Power   porta finalmente l'imbattibile precisione di FX Power ai simboli non-Forex. Determina con precisione l'intensità delle tendenze a breve, medio e lungo termine dei vostri indici preferiti, azioni, materie prime, ETF e persino criptovalute. Potete   analizzare tutto ciò che   il vostro terminale ha da offrire. Provatelo e sperimentate come   il vostro tempismo migliori significativamente   durante il trading. Caratteristiche principali di IX Power Risultati di calcolo precisi al
TrendMaestro5
Stefano Frisetti
nota: questo indicatore e' per METATRADER5, se vuoi la versione per  METATRADER4 questo e' il link:   https://www.mql5.com/it/market/product/108106 TRENDMAESTRO ver 2.4 TRENDMAESTRO   riconosce un nuovo TREND sul nascere, non sbaglia mai. La sicurezza di identificare un nuovo TREND non ha prezzo. DESCRIZIONE TRENDMAESTRO identifica un nuovo TREND sul nascere, questo indicatore prende in esame la volatilita' i volumi ed il momentum per identificare il momento in cui c'e' un'esplosione di uno
Golden Spikes Premium
Kwaku Bondzie Ghartey
Golden Spikes Detector Acknowledgement and Dedications:  The name of this indicator was Inspired by an Original; Mr Grant Koopman; a Knowledgeable and experienced Synthetics trader. I dedicate this indicator to Mr Grant.  Overview: The Golden Spikes Premium is a groundbreaking trading indicator meticulously crafted for the Boom and Crash indices on the Deriv market. Tailored to meet the needs of discerning traders, this powerful tool operates exclusively on the one-minute timeframe, providin
Ora $ 147 (aumentando a $ 499 dopo alcuni aggiornamenti) - account illimitati (PC o MAC) Manuale utente di RelicusRoad + Video di formazione + Accesso al gruppo Discord privato + Stato VIP UN NUOVO MODO DI GUARDARE IL MERCATO RelicusRoad è l'indicatore di trading più potente al mondo per forex, futures, criptovalute, azioni e indici, fornendo ai trader tutte le informazioni e gli strumenti di cui hanno bisogno per rimanere redditizi. Forniamo analisi tecniche e piani di trading per aiutar
XQ Indicator MetaTrader 5
Marzena Maria Szmit
3.5 (2)
Step into the realm of Forex trading with confidence and precision using XQ, a cutting-edge Forex indicator designed to elevate your trading game to unprecedented heights. Whether you're a seasoned trader or just stepping into the world of currency exchange, XQ Forex Indicator empowers you with the insights and signals needed to make informed trading decisions. The signal conditions are a combination of three indicators, and XQ Forex Indicator only display  medium and long-term trends . The ind
Trend Hunter MT5
Andrey Tatarinov
5 (1)
Trend Hunter è un indicatore di tendenza per lavorare nei mercati Forex, criptovaluta e CFD. Una caratteristica speciale dell'indicatore è che segue con sicurezza la tendenza, senza cambiare il segnale quando il prezzo supera leggermente la linea di tendenza. L'indicatore non viene ridisegnato; un segnale per entrare nel mercato appare dopo la chiusura della barra. Quando ci si sposta lungo un trend, l'indicatore mostra ulteriori punti di ingresso nella direzione del trend. Sulla base di ques
The Smart Liquidity Profile is color-coded based on the importance of the traded activity at specific price levels, allowing traders to identify significant price levels such as support and resistance levels, supply and demand zones, liquidity gaps, consolidation zones, Buy-Side/Sell-Side Liquidity and so on.  Smart Liquidity Profile allows users to choose from a number of different time periods including 'Auto,' 'Fixed Range,' 'Swing High,' 'Swing Low,' 'Session,' 'Day,' 'Week,' 'Month,' 'Quart
Questo cruscotto mostra gli ultimi   pattern armonici   disponibili per i simboli selezionati, in modo da risparmiare tempo ed essere più efficienti /   versione MT4 . Indicatore gratuito:   Basic Harmonic Pattern Colonne dell'indicatore Symbol :   vengono visualizzati i simboli selezionati Trend:   rialzista o ribassista Pattern:   tipo di pattern (gartley, butterfly, bat, crab, shark, cypher o ABCD) Entry:   prezzo di ingresso SL:   prezzo di stop loss TP1:   1 prezzo di take profit TP
Volume by Price MT5
Brian Collard
3.6 (5)
The Volumebyprice.com Indicator for MetaTrader 5 features Volume Profile and Market Profile TPO (Time Price Opportunity). Volume and TPO histogram bar and line charts. Volume Footprint charts. TPO letter and block marker collapsed and split structure charts. Static, dynamic and flexible range segmentation and compositing methods with relative and absolute visualizations. Session hours filtering and segment concatenation with Market Watch and custom user specifications. Graphical layering, posit
Volatility Trend System - è un sistema di trading che fornisce segnali per le entrate. Il sistema di volatilità fornisce segnali lineari e puntuali nella direzione del trend, nonché segnali per uscirne, senza ridisegnare o ritardi. L'indicatore di tendenza monitora la direzione del trend a medio termine, mostra la direzione e il suo cambiamento. L'indicatore del segnale si basa sui cambiamenti della volatilità e mostra gli ingressi nel mercato. L'indicatore è dotato di diversi tipi di avvi
Advanced Supply Demand MT5
Bernhard Schweigert
4.53 (15)
La migliore soluzione per qualsiasi principiante o trader esperto! Questo indicatore è uno strumento di trading unico, di alta qualità e conveniente perché abbiamo incorporato una serie di funzionalità proprietarie e una nuova formula. Con questo aggiornamento, sarai in grado di mostrare fusi orari doppi. Non solo potrai mostrare una TF più alta, ma anche entrambe, la TF del grafico, PIÙ la TF più alta: SHOWING NESTED ZONES. Tutti i trader di domanda di offerta lo adoreranno. :) Informazioni imp
ICT, SMC, SMART MONEY CONCEPTS, SMART MONEY, Smart Money Concept, Support and Resistance, Trend Analysis, Price Action, Market Structure, Order Blocks, BOS/CHoCH,   Breaker Blocks ,  Momentum Shift,   Supply&Demand Zone/Order Blocks , Strong Imbalance,   HH/LL/HL/LH,    Fair Value Gap, FVG,  Premium  &   Discount   Zones, Fibonacci Retracement, OTE, Buy Side Liquidity, Sell Side Liquidity, BSL/SSL Taken, Equal Highs & Lows, MTF Dashboard, Multiple Time Frame, BigBar, HTF OB, HTF Market Structure
Matrix Arrow Indicator MT5
Juvenille Emperor Limited
5 (14)
Matrix Arrow Indicator MT5   è un trend unico 10 in 1 che segue un indicatore multi-timeframe al   100% non ridipinto   che può essere utilizzato su tutti i simboli/strumenti:   forex ,   materie prime ,   criptovalute ,   indici ,   azioni .  Matrix Arrow Indicator MT5  determinerà la tendenza attuale nelle sue fasi iniziali, raccogliendo informazioni e dati da un massimo di 10 indicatori standard, che sono: Indice di movimento direzionale medio (ADX) Indice del canale delle materie prime (CCI
Gartley Hunter Multi
Siarhei Vashchylka
5 (8)
Gartley Hunter Multi - An indicator for searching for harmonic patterns simultaneously on dozens of trading instruments and on all possible timeframes. Manual (Be sure to read before purchasing) | Version for MT4 Advantages 1. Patterns: Gartley, Butterfly, Shark, Crab. Bat, Alternate Bat, Deep Crab, Cypher 2. Simultaneous search for patterns on dozens of trading instruments and on all possible timeframes 3. Search for patterns of all possible sizes. From the smallest to the largest 4. A
Blahtech Supply Demand MT5
Blahtech Limited
4.54 (13)
Was: $299  Now: $99   Supply Demand uses previous price action to identify potential imbalances between buyers and sellers. The key is to identify the better odds zones, not just the untouched ones. Blahtech Supply Demand indicator delivers functionality previously unavailable on any trading platform. This 4-in-1 indicator not only highlights the higher probability zones using a multi-criteria strength engine, but also combines it with multi-timeframe trend analysis, previously confirmed swings
Order Block Hunter MT5
Noha Mohamed Fathy Younes Badr
5 (1)
Order block hunter indicator is the best indicator for  hunt the order blocks that area where there has been a large concentration of limit orders waiting to be executed Order blocks are identified on a chart by observing previous price action and looking for areas where the price experienced significant movement or sudden changes in direction .This indicator does that for you by using very complicated codes and helps you to take the best areas To buy and sell because it make marks at the best a
Native Channels
BeeXXI Corporation
5 (2)
This indicator recognizes all support and resistance levels. A number of unique high-performance techniques have been applied, which made the existence of this indicator possible. All formed channels are naturally visible: horizontal linear linear parabolic cubic (Polynomial 3 degrees - Wave) This is due to a bundle of approximating channels. The formed channels form "standing waves" in a hierarchical sequence. Thus, all support and resistance levels are visible. All parameter management is
Auto Order Block with break of structure based on ICT and Smart Money Concepts (SMC) Futures Break of Structure ( BoS )             Order block ( OB )            Higher time frame Order block / Point of Interest ( POI )    shown on current chart           Fair value Gap ( FVG ) / Imbalance   -  MTF      ( Multi Time Frame )    HH/LL/HL/LH  -  MTF      ( Multi Time Frame )  Choch  MTF      ( Multi Time Frame )  Volume Imbalance     ,  MTF          vIMB Gap’s Power of 3 Equal High
Altri dall’autore
VR Smart Grid MT5
Vladimir Pastushak
4.32 (25)
VR Smart Grid è un advisor di trading intelligente in grado di chiudere parzialmente un gran numero di posizioni di mercato con piccoli profitti. La chiusura in piccole parti consente di ridurre rapidamente ed efficacemente le posizioni in perdita. Nell'algoritmo dell'advisor sono programmate diverse strategie di trading ben congegnate. La principale strategia di trading si basa sulla costruzione di una rete di posizioni e sulla chiusura delle posizioni in piccole parti con un determinato profit
VR Lollipop MT5
Vladimir Pastushak
2.33 (6)
Сrescita redditizia è la strategia principale del robot di trading *VR Lollipop*. Esercitare il commercio nella direzione di tendenza, aggiungere posizioni nella direzione di tendenza, spostare le posizioni a nessuna perdita e il più rapidamente possibile per ridurre le perdite, su tali principi è stata costruita la strategia di trading del robot VR Lollipop. Il trend trading con dynamic trailing stop raccoglie in modo più efficiente possibile tutti i movimenti di tendenza. Il robot di trading i
VR Lollipop
Vladimir Pastushak
4.69 (13)
Сrescita redditizia è la strategia principale del robot di trading *VR Lollipop*. Esercitare il commercio nella direzione di tendenza, aggiungere posizioni nella direzione di tendenza, spostare le posizioni a nessuna perdita e il più rapidamente possibile per ridurre le perdite, su tali principi è stata costruita la strategia di trading del robot VR Lollipop. Il trend trading con dynamic trailing stop raccoglie in modo più efficiente possibile tutti i movimenti di tendenza. Il robot di trading i
VR Smart Grid
Vladimir Pastushak
4.35 (177)
VR Smart Grid è un advisor di trading intelligente in grado di chiudere parzialmente un gran numero di posizioni di mercato con piccoli profitti. La chiusura in piccole parti consente di ridurre rapidamente ed efficacemente le posizioni in perdita. Nell'algoritmo dell'advisor sono programmate diverse strategie di trading ben congegnate. La principale strategia di trading si basa sulla costruzione di una rete di posizioni e sulla chiusura delle posizioni in piccole parti con un determinato profit
VR Donchian MT5
Vladimir Pastushak
4.82 (17)
L'indicatore VR Donchian è una versione migliorata del canale Donchian. I miglioramenti hanno interessato quasi tutte le funzioni del canale, ma l'algoritmo operativo principale e la costruzione del canale sono stati preservati. All'indicatore a sfera è stato aggiunto un cambiamento nel colore dei livelli a seconda della tendenza attuale: questo mostra chiaramente al trader un cambiamento di tendenza o un livello piatto. È stata aggiunta la possibilità di informare il trader del superamento di u
FREE
VR ATR Pro
Vladimir Pastushak
4.43 (7)
VR ATR Pro is a powerful professional tool for determination of target levels on a financial instrument. The indicator's effectiveness has been proved by thousands tests on real and demo accounts. VR ATR Pro is the indicator that works on real data using live true statistics. Statistics is stubborn, the usage of real statistical data in mathematical calculations allows you to calculate the exact target levels for a financial instrument. Per una serie di file, istruzioni e un bel bonus scrivimi A
VR Sync Charts
Vladimir Pastushak
5 (7)
VR Sync Charts is a tool for synchronizing layout between windows. INDICATOR DOES NOT WORK IN STRATEGY TESTER!!! How to get a trial version with a test period, instructions, training, read the blog https://www.mql5.com/ru/blogs/post/726504 . VR Sync Charts allow you to synchronize trend levels, horizontal levels and Fibonacci layout with all charts. With this you can synchronize all standard graphic objects in the MetaTrader terminal. All your trends, Gann lines and other objects are exactly cop
VR Donchian
Vladimir Pastushak
4.83 (18)
L'indicatore VR Donchian è una versione migliorata del canale Donchian. I miglioramenti hanno interessato quasi tutte le funzioni del canale, ma l'algoritmo operativo principale e la costruzione del canale sono stati preservati. All'indicatore a sfera è stato aggiunto un cambiamento nel colore dei livelli a seconda della tendenza attuale: questo mostra chiaramente al trader un cambiamento di tendenza o un livello piatto. È stata aggiunta la possibilità di informare il trader del superamento di u
FREE
VR Watch list and Linker MT5
Vladimir Pastushak
4.89 (9)
Elenco di controllo VR e Linker - applicazione di screening per il terminale Meta Trader . Rende più facile trovare gli strumenti finanziari più interessanti e tecnici. Questo screener viene utilizzato dai trader per fare trading su borse come Bybit, Borsa di Mosca, American Exchange, mercato dei cambi e delle criptovalute, mercato dei metalli e viene utilizzato per il trading in società di prop. La selezione degli strumenti finanziari viene effettuata manualmente. Lo screener collega i grafici
FREE
VR Pivot
Vladimir Pastushak
VR Pivot is an indicator of key pivot points. Pivot points are a special type of support and resistance levels that are used to determine the strongest price zones. Professional traders use pivot levels to determine prices at which there is a high probability of a price reversal. The levels are calculated using special mathematical formulas, which include the closing, opening, high, and low prices of the previous time period. The most effective is the daily period. It is important to note that a
VR Color Levels MT5
Vladimir Pastushak
VR Color Levels è uno strumento utile per coloro che applicano l'analisi tecnica utilizzando elementi come linea di tendenza, rettangolo e testo. È possibile aggiungere testo direttamente al grafico e acquisire screenshot. È possibile ottenere impostazioni, file di set, versioni demo, istruzioni e risoluzione dei problemi da [blog] Puoi leggere o scrivere recensioni su [collegamento] Versione per [MetaTrader 4] Il lavoro con l'indicatore viene eseguito in un clic . Per fare ciò, fare clic su
FREE
VR Sync Charts MT5
Vladimir Pastushak
5 (4)
VR Sync Charts is a tool for synchronizing layout between windows. INDICATOR DOES NOT WORK IN STRATEGY TESTER!!! How to get a trial version with a test period, instructions, training, read the blog https://www.mql5.com/ru/blogs/post/726504 . VR Sync Charts allow you to synchronize trend levels, horizontal levels and Fibonacci layout with all charts. With this you can synchronize all standard graphic objects in the MetaTrader terminal. All your trends, Gann lines and other objects are exactly cop
VR Locker MT5
Vladimir Pastushak
3.5 (4)
Forex Expert Advisor VR Locker è una strategia di trading automatica basata sul trading a griglia che utilizza blocchi positivi. Un blocco positivo è una situazione in un conto di trading in cui una posizione di vendita è sopra una posizione di acquisto ed entrambe le posizioni sono aperte con lo stesso lotto. Per una serie di file, istruzioni e un bel bonus scrivimi Il monitoraggio del lavoro dell'advisor può essere trovato nel profilo dell'autore L'Expert Advisor è stato sviluppato per la co
VR Ticks MT5
Vladimir Pastushak
4.33 (3)
VR Ticks   è un indicatore speciale per strategie basate sullo scalping. Grazie a questo indicatore il trader può vedere il grafico tick direttamente sul grafico principale dello strumento finanziario. Un grafico tick ti consente di inserire una posizione nel mercato o chiudere una posizione nel mercato nel modo più accurato possibile. VR Ticks traccia i dati dei tick sotto forma di linee che cambiano colore a seconda della direzione: ciò consente di comprendere e valutare visivamente la situazi
FREE
VR Assistant Charts MT5
Vladimir Pastushak
5 (3)
VR Assistant Charts — Questo è uno strumento utile per i trader che lavorano con oggetti grafici nella finestra del terminale di trading MetaTrader. Il programma ti consente di modificare il colore, lo stile, lo spessore e altre caratteristiche delle linee di tendenza, dei livelli di Fibonacci, dei ventagli di Gann e di altri elementi grafici nel terminale MetaTrader con un clic del mouse. È possibile ottenere impostazioni, file di set, versioni demo, istruzioni e risoluzione dei problemi da [bl
FREE
VR Template switcher
Vladimir Pastushak
5 (1)
VR Template Switcher è una potente utility per la gestione dei modelli di grafici nel terminale MetaTrader. Non c'è più bisogno di fare molto per caricare, salvare e cancellare i modelli. L'utility VR Template Switcher permette di salvare il modello di grafico corrente con tutti gli indicatori, i livelli e le impostazioni, nonché di caricarne un altro con un solo clic. Hai modelli per diversi strumenti finanziari? VR Template Switcher imposta il periodo e lo strumento finanziario richiesto quand
VR Color Levels MT4
Vladimir Pastushak
VR Color Levels è uno strumento utile per coloro che applicano l'analisi tecnica utilizzando elementi come linea di tendenza, rettangolo e testo. È possibile aggiungere testo direttamente al grafico e acquisire screenshot. È possibile ottenere impostazioni, file di set, versioni demo, istruzioni e risoluzione dei problemi da [blog] Puoi leggere o scrivere recensioni su [collegamento] Versione per [MetaTrader 5] Il lavoro con l'indicatore viene eseguito in un clic . Per fare ciò, fare clic su
FREE
VR Grid Mt5
Vladimir Pastushak
3.6 (10)
L'indicatore Griglia VR è progettato per creare una griglia grafica con impostazioni definite dall'utente. A differenza della griglia standard , VR Grid viene utilizzata per costruire livelli circolari . A seconda della scelta dell'utente, il passaggio tra i livelli rotondi può essere arbitrario. Inoltre, a differenza di altri indicatori e utilità, VR Grid mantiene la posizione della griglia anche quando cambia l'intervallo di tempo o si riavvia il terminale. È possibile ottenere impostazioni, f
FREE
VR Atr Pro MT5
Vladimir Pastushak
4.75 (4)
VR ATR Pro is a powerful professional tool for determination of target levels on a financial instrument. The indicator's effectiveness has been proved by thousands tests on real and demo accounts. VR ATR Pro is the indicator that works on real data using live true statistics. Statistics is stubborn, the usage of real statistical data in mathematical calculations allows you to calculate the exact target levels for a financial instrument. Per una serie di file, istruzioni e un bel bonus scrivimi A
VR Alert MT5
Vladimir Pastushak
5 (2)
The VR Alert indicator utility is designed to monitor the price or other indicators and to inform the trader when the price or indicator reaches the given level. The signal levels can be set not only horizontally but also inclined. Thus, the trader gets the opportunity to receive notifications from the inclined trend levels. Thanks to the VR Alert utility, you will no longer need to sit near the monitor for a long time. You can calmly do about your household chores, perform your work duties and
VR Grid
Vladimir Pastushak
4.57 (7)
L'indicatore Griglia VR è progettato per creare una griglia grafica con impostazioni definite dall'utente. A differenza della griglia standard , VR Grid viene utilizzata per costruire livelli circolari . A seconda della scelta dell'utente, il passaggio tra i livelli rotondi può essere arbitrario. Inoltre, a differenza di altri indicatori e utilità, VR Grid mantiene la posizione della griglia anche quando cambia l'intervallo di tempo o si riavvia il terminale. È possibile ottenere impostazioni, f
FREE
VR Watch list and Linker
Vladimir Pastushak
4.67 (9)
Elenco di controllo VR e Linker - applicazione di screening per il terminale Meta Trader . Rende più facile trovare gli strumenti finanziari più interessanti e tecnici. Questo screener viene utilizzato dai trader per fare trading su borse come Bybit, Borsa di Mosca, American Exchange, mercato dei cambi e delle criptovalute, mercato dei metalli e viene utilizzato per il trading in società di prop. La selezione degli strumenti finanziari viene effettuata manualmente. Lo screener collega i grafici
FREE
VR Cub
Vladimir Pastushak
VR Cub è un indicatore per ottenere punti di ingresso di alta qualità. L'indicatore è stato sviluppato per facilitare i calcoli matematici e semplificare la ricerca dei punti di ingresso in una posizione. La strategia di trading per la quale è stato scritto l'indicatore ha dimostrato la sua efficacia per molti anni. La semplicità della strategia di trading è il suo grande vantaggio, che consente anche ai trader alle prime armi di commerciare con successo con essa. VR Cub calcola i punti di apert
VR Template Switcher è una potente utility per la gestione dei modelli di grafici nel terminale MetaTrader. Non c'è più bisogno di fare molto per caricare, salvare e cancellare i modelli. L'utility VR Template Switcher permette di salvare il modello di grafico corrente con tutti gli indicatori, i livelli e le impostazioni, nonché di caricarne un altro con un solo clic. Hai modelli per diversi strumenti finanziari? VR Template Switcher imposta il periodo e lo strumento finanziario richiesto quand
VR Assistant Charts
Vladimir Pastushak
VR Assistant Charts — Questo è uno strumento utile per i trader che lavorano con oggetti grafici nella finestra del terminale di trading MetaTrader. Il programma ti consente di modificare il colore, lo stile, lo spessore e altre caratteristiche delle linee di tendenza, dei livelli di Fibonacci, dei ventagli di Gann e di altri elementi grafici nel terminale MetaTrader con un clic del mouse. È possibile ottenere impostazioni, file di set, versioni demo, istruzioni e risoluzione dei problemi da [bl
FREE
VR Close Orders MT5
Vladimir Pastushak
3 (2)
The VR Close orders script is designed to close positions in the terminal at a profit or loss mark set by the trader. The program is written as a script and can work together on the same chart with any other indicators and expert advisors. The program has a simple visual panel and is easy to configure with the mouse. With this program's help, the trader can automatically close positions and delete orders depending on the conditions set.  There is often a situation when you need to close position
FREE
VR Calculate Martingale MT5
Vladimir Pastushak
5 (1)
The VR Calculate Martingale indicator is a powerful order and position calculator for calculating profit or loss. With the help of the order and position calculator, a trader can calculate the average price of any forex currency, stocks or crypto currency. Now you can connect the indicator and start superimposing virtual orders on your real orders and positions. By creating additional virtual positions, you can calculate any development of the situation. The indicator has a built-in lot calculat
VR Ticks
Vladimir Pastushak
VR Ticks è un indicatore speciale per strategie basate sullo scalping. Grazie a questo indicatore il trader può vedere il grafico tick direttamente sul grafico principale dello strumento finanziario. Un grafico tick ti consente di inserire una posizione nel mercato o chiudere una posizione nel mercato nel modo più accurato possibile. VR Ticks traccia i dati dei tick sotto forma di linee che cambiano colore a seconda della direzione: ciò consente di comprendere e valutare visivamente la situazion
FREE
VR Orders History MT5
Vladimir Pastushak
3 (2)
The VR Orders History script is designed to upload a trade report to a csv file. This format is intended for additional analysis of trading history in programs such as EXCEL, Openoffice, and Libreoffice. Thanks to the script, it is now much easier for a trader to analyze their trading history. The program facilitates the analysis of the trading history for the MetaTrader 5 terminal. The trader sees structured trading. The entire report is based on the following principle: Position > Order on the
FREE
VR Orders History
Vladimir Pastushak
4.29 (7)
The VR Orders History script is designed to upload a trade report to a csv file. This format is intended for additional analysis of trading history in programs such as EXCEL, Openoffice, and Libreoffice. Thanks to the script, it is now much easier for a trader to analyze their trading history. The program facilitates the analysis of the trading history for the MetaTrader 5 terminal. The trader sees structured trading. The entire report is based on the following principle: Position > Order on the
FREE
Filtro:
Oluseyi Elemosho
316
Oluseyi Elemosho 2021.08.18 19:53 
 

L'utente non ha lasciato alcun commento sulla valutazione.

Vladimir Pastushak
93184
Risposta dello sviluppatore Vladimir Pastushak 2021.08.19 09:51
Thank you!!
Andrey Ivanitsky
120
Andrey Ivanitsky 2021.04.27 21:09 
 

L'utente non ha lasciato alcun commento sulla valutazione.

Vladimir Pastushak
93184
Risposta dello sviluppatore Vladimir Pastushak 2021.04.28 07:25
Спасибо!
MAKARIOS YACOUBIAN
2911
MAKARIOS YACOUBIAN 2021.04.20 18:39 
 

L'utente non ha lasciato alcun commento sulla valutazione.

Vladimir Pastushak
93184
Risposta dello sviluppatore Vladimir Pastushak 2021.04.20 19:47
Thank you!!
varon
491
varon 2021.03.27 08:50 
 

L'utente non ha lasciato alcun commento sulla valutazione.

Vladimir Pastushak
93184
Risposta dello sviluppatore Vladimir Pastushak 2021.03.27 08:54
Thanks!
Vladimir Shumikhin
1964
Vladimir Shumikhin 2021.03.24 05:10 
 

L'utente non ha lasciato alcun commento sulla valutazione.

Vladimir Pastushak
93184
Risposta dello sviluppatore Vladimir Pastushak 2021.03.27 08:55
Спасибо!
Sergei Viakhirev
252
Sergei Viakhirev 2021.03.23 22:10 
 

L'utente non ha lasciato alcun commento sulla valutazione.

Vladimir Pastushak
93184
Risposta dello sviluppatore Vladimir Pastushak 2021.03.27 08:55
Спасибо!
Cleverson Santos
742
Cleverson Santos 2021.03.22 00:41 
 

L'utente non ha lasciato alcun commento sulla valutazione.

Vladimir Pastushak
93184
Risposta dello sviluppatore Vladimir Pastushak 2021.03.22 08:58
Thank!
Rispondi alla recensione
Versione 23.20 2023.02.13
Increased the speed of the indicator;
Added the ability to select the type of price display. It can be text, or an icon;
Versione 21.80 2021.08.17
The program is compiled in the latest version of the MetaTrader terminal