• Panoramica
  • Recensioni
  • Commenti
  • Novità

UPD1 Impulse Candle

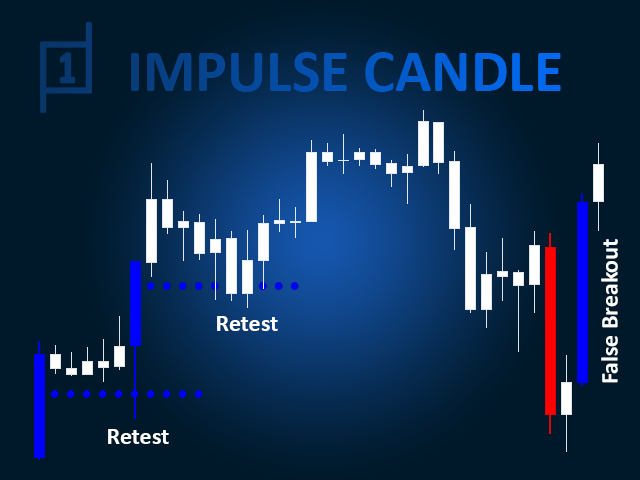
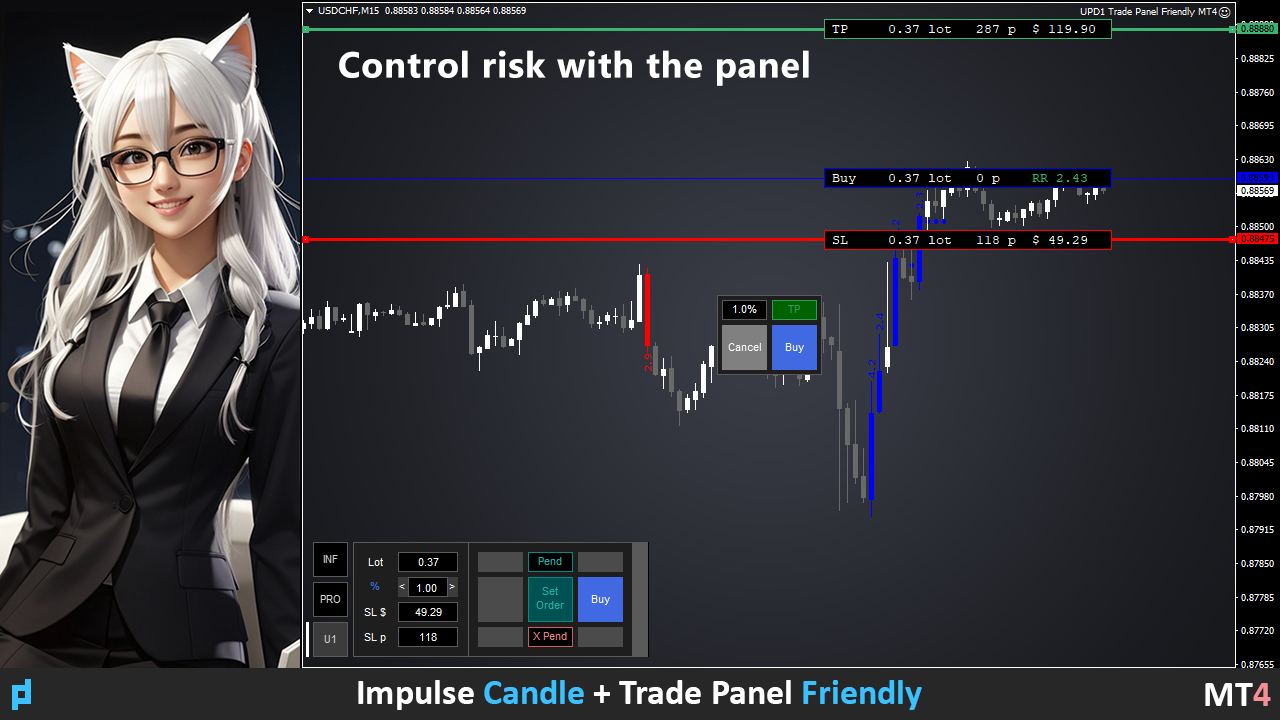
L'indicatore cerca le candele a impulso e le visualizza sul grafico.

Include un filtro per le ombre. Trova anche i livelli di breakout delle Bande di Bollinger.

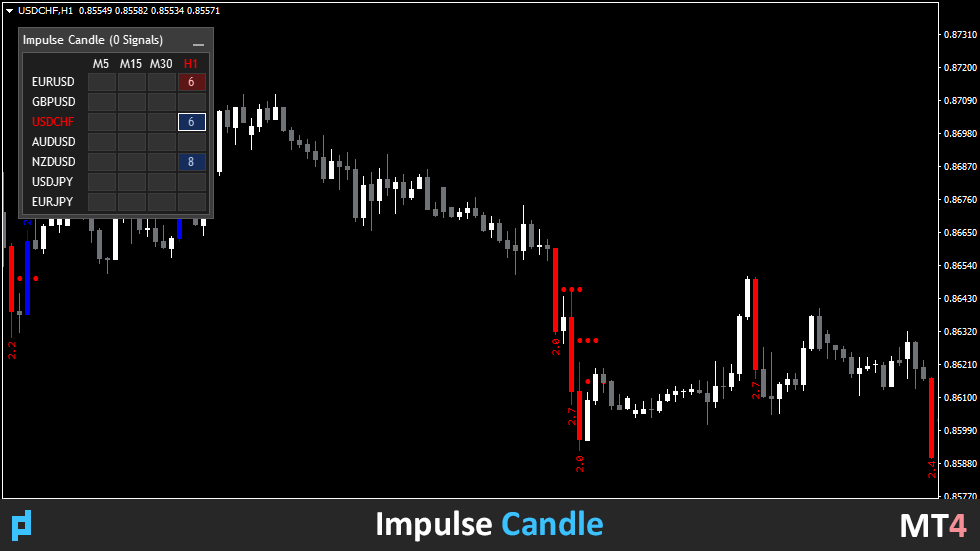
È possibile attivare il cruscotto multivaluta nelle impostazioni.

Per gli avvisi si può scegliere tra il grafico corrente o l'intero elenco.

Blog-Link - Retest and Fake Breakout with UPD1


Modelli di trading:

  • Trend retest.
  • Falso breakout.
  • Altri.


EURUSD, GBPUSD, XAUUSD, ...

M15, M30, H1.


Parametri di ingresso.


Di base.

Bars Count - il numero di barre storiche su cui lavorerà l'indicatore.

Coeff Period - periodo di calcolo.

Min HL Coeff - coefficiente al di sopra del quale vengono ricercate le candele. Il valore predefinito è 2,0, ma per ottenere un maggior numero di segnali su timeframe più elevati si può impostare 1,5.

Shadow Filter - più alto è il valore, più grande può essere la dimensione delle ombre sulle candele. È auspicabile impostare un valore di 50 e inferiore.


    Visualizzazione delle candele.

    Color Bar – abilita/disabilita il riempimento della candela.

    Width Color Bar (-1 auto) – spessore del riempimento. L'impostazione predefinita è -1 auto, in cui il riempimento corrisponde allo spessore della candela.

    Show Arrows On Chart – visualizza valori numerici sopra le candele di grandi dimensioni. Essi indicano quante volte la candela è più grande del valore medio.

    UP Label Color - il colore della candela Buy.

    DN Label Color - il colore della candela Sell.

    Indent Coeff - rientro del numero dalla candela.

    Size – dimensione del carattere.


      Impostazioni delle Bande di Bollinger.

      BB Filter - se abilitato, visualizza solo le candele di grandi dimensioni che hanno chiuso dietro il canale.

      MA Period - periodo della media mobile.

      MA Price - parametri del prezzo.

      MA Deviation - impostazione della deviazione.

      MA Shift - impostazione dell'offset.


      BB Cross OC Candle - mostra o meno l'attraversamento della candela grande del canale (per chiusura).

      BB Cross Extend Bars - lunghezza della linea.

      BB Cross Arrow Code - codice dell'icona.

      BB Cross Arrow Size - dimensione dell'icona.


        Impostazioni del cruscotto.

        Dashboard - attiva/disattiva il dashboard multi-valuta multi-timeframe.

        Scan Bars - quante barre nella storia monitorare dopo la fine del segnale (default è 2, ci sono 5, 10, 20, 30).

        Dashboard Zoom % (0 -auto) - zoom visivo del cruscotto.

        Color Theme - selezione automatica o manuale del tema colore del pannello (chiaro e scuro).

        Symbol Lyst - elenco dei simboli. Puoi inserire qualsiasi strumento separato da virgole.

        View M1-MN - attiva/disattiva un intervallo di tempo specifico.


        Impostazioni degli avvisi.

        Alert - attiva / disattiva avviso.

        Current Chart – avviso solo sul grafico corrente, ignorando i segnali del cruscotto.

        Dashboard List – avviso quando compaiono nuovi segnali nel cruscotto.

        Alert Work Time - periodo di tempo in cui l'allarme funzionerà.

        Alert Pop Up - abilita / disabilita il popup di avviso.

        Alert Push - Abilita / Disabilita l'avviso sul telefono.

        Alert E-mail - Abilita / Disabilita l'invio di avvisi e-mail.

        Alert Sound - Abilita / Disabilita l'allarme.

        Alert Sound Name - nome del file audio.


        Prodotti consigliati
        Just Currency Strength is a simple, and easy to use as a market analysis tool. It could helps trader to understand the broder view of the market and forcasting the movemt of each currency symbol and trend direction of each specific currency pair. Parameters Timeframe (Move Timeframe box to move the pannel) Currency (Must NOT be less than 5 currencies) Refreshtime in second Colors Strong//Weak//Neutrial Alerts setting Alert On/Off Push notification On/Off Happy Trading...
        FREE
        Dark Breakout
        Marco Solito
        4.89 (9)
        Dark Breakout   is an Indicator for intraday trading. This Indicator is based on Trend Following  strategy, providing an entry signal on the breakout. The signal is provided by the arrow, which confirms the breaking of the level. We can enter in good price with this Indicator, in order to follow the main trend on the current instrument. It is advised to use low spread ECN brokers. This Indicator does Not repaint and N ot lag . Recommended timeframes are M5, M15 and H1. Recommended working pairs
        EForex 2 EMAs Cross Over
        Veridiana Adorno Kendrick
        Become a constantly profitable 5-star forex trader!  We offer a few indicators to support you understand and analyse the market! With our strategies you will improve your trading system and bacome an expert... We have indicators for trend direction, market direction and others.. for multi-time frames and that covers all majors or your favorite trading symbols! Some of them offer a customizable calculation parameters... or Graph features! See how powerful they are! The are also easy-to-use tr
        Smart trends view
        Maria Cristina Sabatini
        Clear trend filter   This is a filter-trend indicator.  From the settings you can select to use more filter or less. The very interesting part of the indicator comes out using with all the filter. In this way you can follow the trend easily even when the market is without a strong trend, but is instead more flat. I personally use it on 1 minutue timeframe with  MORE FILTER (you can select it from the input setting) in order to have an overlook of trend in the market.   Added: - Sound Notificatio
        OBV Trend mt4
        Natasha Diedericks
        This indicator takes input from the OBV and a trend filter, and presents the output in a separate indicator window as a histogram. Great for scalping. Settings: TrendPeriod Features Alerts. How to use: Simply attach to any chart with default setting, or set the TrendPeriod to your preference. Zoom chart in to get a better view of the histo color. Buy:  Blue histo color on multiple timeframes. (e.g., M15-M30-H1-H4) Sell: Red histo color  on multiple timeframes. Or backtest and use as you see fit
        Candle close countdown indicator. Almost all indicators work by ticks and therefore stop counting when the price stops in moments of little volatility. This indicator does not stop and remains synchronized with the broker's clock. It also has other functions that can help the trader. All features are configurable and you can choose if you want to use it or not: - Volume control:                         the counter changes color when the current candle has a higher volume of contracts than the pr
        Separated Volume
        Ivan Stefanov
        5 (1)
        Questo indicatore separa efficacemente il volume dei tick nel mercato forex in categorie rialziste e ribassiste. Inoltre, fornisce la funzionalità di calcolare e visualizzare la somma dei volumi dei tick rialzisti e ribassisti per qualsiasi periodo selezionato a scelta. È possibile regolare facilmente il periodo spostando le due linee blu sul grafico, consentendo un'analisi dei volumi personalizzabile e precisa, adatta alle proprie esigenze di trading. Se lo trovate utile, le vostre recensio
        FREE
        Momentum Jurik
        Augustine Kamatu
        Introducing Momentum Jurik—an innovative indicator designed to optimize your forex trading strategy by incorporating custom moving averages based on the Momentum indicator with the MetaTrader 4 indicator, Momentum. Jurik moving averages are renowned for their precision and reliability in analyzing price movements in the forex market. They provide traders with smoother representations of price action, reducing noise and offering clearer signals for identifying trends and potential reversals. T
        FREE
        KT Psar Arrows
        KEENBASE SOFTWARE SOLUTIONS
        KT Psar Arrows plots the arrows on chart using the standard Parabolic SAR indicator. A bullish arrow is plotted when the candle's high touch the SAR. A bearish arrow is plotted when the candle's low touch the SAR. The signals are generated in the real-time without waiting for the bar close.  Features A beneficial tool for traders who want to experiment with the trading strategies that include the use of Parabolic Sar indicator.  Can be used to find turning points in the market. Use custom PSAR
        BBandsEx
        Andrej Nikitin
        Advanced Bollinger Bands (BB) indicator. The standard Bands.mq4 indicator was complemented with a range of upper/lower band and signal of possible reverses. Parameters: BandsPeriod - indicator period. BandsRange - period of determining a range. BandsDeviations - number of standard deviations. Averaging Fast Period - fast period of averaging. Averaging Slow Period - slow period of averaging. Buffer indexes: 0 - Middle line, 1 - Upper line, 2 - Lower line, 3 - Upper range, 4 - Lower range, 5 -
        Pro Trader mt4
        Natasha Diedericks
        This indicator takes input from the RSI and a trend filter, and presents the output in a separate indicator window as a histogram. Great for scalping. Settings: No need to set up the indicator. Features Alerts. How to use: Simply attach to any chart Zoom chart in to get a better view of the histo color. Buy:  Blue histo color on multiple timeframes. (e.g,. M30-H1-H4) Sell: Red histo color  across on multiple timeframes. Or backtest and use as you see fit for your strategy. Best results on Major
        Dragon Trend
        Marco Fornero Monia
        Trend indicator with Multi-level Take Profit indication. Possibility to setting in normal or Aggressive mode. Fully customizable in color and alarm. Very useful to understand the trend and where price could go No need to explain, see the images. You'll se the trend, 3 possibly target and stop loss (or other take profit) when the trend change. You can adopt various strategy, for example. 1) Open trade and try to close it at target 1 2) Open 2 trade, close 1 at target 1, stop in profit for 2 and t
        IVolX 2 DPOC
        Denis Chebatarev
        Vol 2 DPOC volume vol 2 DOC-dynamic horizontal volume indicator for any time periods Main settings of the indicator: Volume Source -selecting data for volumes (tick or real) DPOCOn -enabling / disabling the indicator DPOCFrom -calculation start date DPOCTo -settlement end date The indicator allows you to manually select areas on the chart to analyze changes in the maximum volume over time. You can do this by using vertical lines and moving them along the chart. Or by setting specific dates in
        Elephant Candle
        David Leander Tschacher
        The Elephant Candle is an indicator for MT4. It draws arrows when strong bullish or bearish candles appear. Strong candles frequently initiate a new trend. The arrows can be used in expert advisors. This indicator can improve already existing trading strategies. The indicator is very fast and doesn't repaint. Inputs Period Candle Multiplier Candle Niceness [%] Arrow Size Enable Alert Enable Push Notification Enable Email
        This indicator shows the high volume zone. From the last minutes that you set yourself, the image of the volume zone is generated on an ongoing basis. The indicator also shows the V-Poc, Average Volumen and V-WAP lines. if you are using high intervals you must enter a large number of minutes. the zone builds itself up as the chart moves. if you want to build a zone from:  last day - 1440 minutes,    last week - 10080 minutes, ... etc. If you need an indicator that shows the constant volume zone
        Indicatore Crypto_Forex Oscillatore HTF OsMA per MT4. - HTF OsMA è uno dei migliori indicatori di tendenza sul mercato. HTF significa - Higher Time Frame. - Questo indicatore è eccellente per i sistemi di trading Multi-Time Frame con voci Price Action o in combinazione con altri indicatori. - L'indicatore HTF OsMA consente di collegare OsMA da Higher time frame al grafico corrente --> questo è un approccio di trading professionale. // Altri fantastici Expert Advisor e indicatori sono disponib
        KT Forex Trend Rider MT4
        KEENBASE SOFTWARE SOLUTIONS
        KT Forex Trend Rider uses a trend following algorithm developed specifically for the Forex market to provide reliable buy & sell signals across the major currency pairs. It works best on major FX pairs and all time-frames. Features It comes with a Multi-Timeframe scanner that can search for upcoming signals across all the time-frames. It comes with four preset profiles to facilitate trading for scalpers, tick-trend, swing, and trend traders. It marks the potential reversal points in the market.
        What does this do? It shows you on the chart which stop belongs to which entry.  Have you ever had multiple positions or trades open on a single pair and were confused which stop loss goes with what entry? Even worse, the stop loss orders for buy and sells are the same color on the chart. Well, your problem has been solved! This indicator will show you which stop belongs to which entry.  It will place a vertical line and an arrow on the chart for each open trade. A yellow line connects the entry
        Indicatore Crypto_Forex "HTF Bollinger Bands" per MT4. - Aggiorna i tuoi metodi di trading con l'indicatore professionale "HTF Bollinger Bands" per MT4. HTF significa - Higher TimeFrame. - Bollinger Bands è uno dei migliori indicatori sul mercato, strumento perfetto per il trading. - Circa il 90% dell'azione dei prezzi si verifica tra le due bande. - L'indicatore HTF Bollinger Bands è eccellente per i sistemi di trading Multi TimeFrame con voci Price Action o in combinazione con altri indicato
        " Valiant Strong Trend " - Your Ultimate MT4 Signal Indicator Are you ready to elevate your trading game to new heights? Look no further than the "Valiant Strong Trend" MT4 signal indicator, your indispensable tool for navigating the complex world of financial markets. Key Features: Precise Trend Identification : "Valiant Strong Trend" employs advanced algorithms to accurately identify market trends, whether they are bullish or bearish. Say goodbye to guesswork and hello to informed trading deci
        MACD Level Alert MT4
        Prafull Manohar Nikam
        This is a simple arrow system based on MACD indicators Main/Base line and MACD Levels. It gives you alerts when MACD's Main Line crosses above/below certain level. Which type of alerts available? 1. It paints on chart Up/Down Arrows. 2. Popup message and sound alert in trading terminal window. 3. Push notification or Alert on your android and ios mobile phones (requires MT4 or MT5 app installed!)
        REMINDER: Early buyers hot price discount: Price subject to rise after first 20 copies. Starting price $65 and final price will be $1275. Secure your discounted copy Now! Smart Money Analyser Indicator User Manual 1. Introduction Welcome to the   Smart Money Analyser Indicator This powerful tool provides traders with comprehensive market analysis by combining various technical indicators to generate actionable trading signals. Designed to be user-friendly, this indicator helps traders of all
        Hello Guys! I want to share with you a very simple but very effective indicator, which I use a lot in my daily trading. Bollinger bands are one of the most effective tools in trading, especially for those who like to operate on low time frames and prefer fast operations. The indicator detects fast reversals: when the price close above or below the Bollinger Bands, but then re-enters in the Bands on the next candle, the indicator sends a signal and draws an arrow on the newly opened candle! It i
        No Repaint Bext is a ready-made trading system. Shows when to open and when to close trades, as well as in which direction. Every time a green arrow appears, you need to open a buy trade. Close all buy trades when a red arrow appears. The same goes for the opposite direction, every time a red arrow appears, open sell trades and close them all when a green arrow appears. We use the M5 timeframe for trading. You can trade on any cozy pair. This indicator does not repaint and practically does not
        UTBot with EMA filter
        Bartlomiej Tadeusz Tomaja
        Advanced ATR Trailing Stop with EMA Filter Indicator Introducing the ATR Trailing Stop with EMA Filter Indicator , a powerful tool designed to enhance your trading strategy with advanced signal filtering. This indicator combines the precision of ATR (Average True Range) trailing stop calculations with the flexibility of an EMA (Exponential Moving Average) filter, ensuring you capture the best opportunities in the market. Key Features: Dual Signal Arrows: The indicator provides two types of arrow
        Implement
        Vitalii Zakharuk
        5 (1)
        Implement analyzes market dynamics for pivot points. If you want to learn how to spot the correct reversals for consistently likely profitable trading, buy this indicator. Shows favorable moments of entering the market in stripes. Ready-made trading system. The principle of operation of the indicator is to automatically determine the current state of the market when placed on a chart, analyze historical data based on historical data and display instructions for further actions on the trader's
        Market Analyst
        Szymon Palczynski
        My new system... This is not a regular channel. Who is it for: - For people who want to understand the market. Tested and used in the real market (I use and not just encodes) Important !!! The system requires thinking. Only for real traders. If you are looking for a holy grail - please don't bother me. Is it possible? Trading has never been so easy. A combination of fibonacci and an intelligent channel plus levels of support and resistance. Setting out a channel is now very easy. Chan
        Daedal
        Iurii Tokman
        Daedal   This indicator is a kind of graphical analysis of price movements for instantly determining the state of the market, which allows you to determine at what stage of the state it is. The indicator is plotted in the lower separate window, separated from the main chart. Using the indicator, you can get information about a possible change in the direction of price movement, and therefore the possibility of opening positions in the desired direction. Description of indicator settings: bar_lim
        Vi presentiamo l'indicatore Donchian Channels per MQL4, uno strumento potente di analisi tecnica progettato per aumentare il successo delle vostre operazioni. Questo indicatore è composto da quattro linee che rappresentano i limiti superiori e inferiori del movimento dei prezzi in un periodo specificato. Con l'indicatore Donchian Channels potete facilmente individuare potenziali rotture e inversioni di tendenza sul mercato. La linea superiore mostra il massimo più alto del periodo specificato, m
        Please contact me at telegram  https://t.me/smartforex7 After purchasing SmartForex Indicator then Use This Indicator...................... SMART EXIT PROFIT LINE Indicator is very Helpful with SmartForex Indicator ........................................ SMART EXIT PROFIT LINE Indicator Attach with SmartForex Indicator after then Red Line Show Exit buy Profit , Green Line show Exit Sell Profit................
        FREE
        Gli utenti di questo prodotto hanno anche acquistato
        Gann Made Easy
        Oleg Rodin
        4.8 (113)
        Gann Made Easy è un sistema di trading Forex professionale e facile da usare che si basa sui migliori principi del trading utilizzando la teoria di mr. WD Gann. L'indicatore fornisce segnali ACQUISTA e VENDI accurati, inclusi i livelli di Stop Loss e Take Profit. Puoi fare trading anche in movimento utilizzando le notifiche PUSH. Vi prego di contattarmi dopo l'acquisto! Condividerò i miei consigli di trading con te e fantastici indicatori bonus gratuitamente! Probabilmente hai già sentito parlar
        Dynamic Forex28 Navigator
        Bernhard Schweigert
        5 (4)
        Dynamic Forex28 Navigator - Lo strumento di trading Forex di nuova generazione. ATTUALMENTE SCONTATO DEL 49%. Dynamic Forex28 Navigator è l'evoluzione dei nostri indicatori popolari di lunga data, che combinano la potenza di tre in uno: Advanced Currency Strength28 Indicator (695 recensioni) + Advanced Currency IMPULSE con ALERT (520 recensioni) + CS28 Combo Signals (Bonus). Dettagli sull'indicatore https://www.mql5.com/en/blogs/post/758844 Cosa offre l'indicatore di forza di nuova generazione?
        Gold Stuff
        Vasiliy Strukov
        4.86 (251)
        Gold Stuff è un indicatore di tendenza progettato specificamente per l'oro e può essere utilizzato anche su qualsiasi strumento finanziario. L'indicatore non ridisegna e non è in ritardo. Periodo consigliato H1. Su di esso l'indicatore funziona in modo completamente automatico Expert Advisor EA Gold Stuff. Lo trovi nel mio profilo. I risultati in tempo reale possono essere visualizzati qui.  Puoi ottenere una copia gratuita del nostro indicatore Strong Support e Trend Scanner, per favore scriv
        -   Real price is 80$   - 40% Discount ( It is 49$ now ) - Lifetime update free Contact me for instruction, add group and any questions! Related Products:  Bitcoin Expert , Gold Expert - Non-repaint - I just sell my products in Elif Kaya profile, any other websites are stolen old versions, So no any new updates or support. Introduction The breakout and retest strategy is traded support and resistance levels. it involves price breaking through a previous level.  The break and retest strategy is
        Scalper Inside PRO
        Alexey Minkov
        4.76 (63)
        !SPECIAL SALE! An exclusive indicator that utilizes an innovative algorithm to swiftly and accurately determine the market trend. The indicator automatically calculates opening, closing, and profit levels, providing detailed trading statistics. With these features, you can choose the most appropriate trading instrument for the current market conditions. Additionally, you can easily integrate your own arrow indicators into Scalper Inside Pro to quickly evaluate their statistics and profitability
        Gold Venamax MT4
        Sergei Linskii
        5 (1)
        Gold Venamax : questo è il miglior indicatore tecnico azionario. L'algoritmo dell'indicatore analizza il movimento dei prezzi di un asset e riflette la volatilità e le potenziali zone di ingresso. Caratteristiche dell'indicatore: Questo è un super indicatore con Magic e due blocchi di frecce di tendenza per un trading comodo e redditizio. Sul grafico viene visualizzato il pulsante rosso per cambiare blocco. Magic è impostato nelle impostazioni dell'indicatore, in modo da poter installare l'in
        Lux Trend
        Mohamed Hassan
        5 (3)
        After purchase, please contact me to get your trading tips + more information for a great bonus!   Lux Trend is a professional strategy based on using Higher Highs and Lower Highs to identify and draw Trendline Breakouts! Lux Trend  utilizes two Moving Averages to confirm the overall trend direction before scanning the market for high-quality breakout opportunities, ensuring more accurate and reliable trade signals. This is a proven trading system used by real traders worldwide, demonstrating
        Currency Strength Wizard è un indicatore molto potente che ti fornisce una soluzione all-in-one per un trading di successo. L'indicatore calcola la potenza di questa o quella coppia forex utilizzando i dati di tutte le valute su più intervalli di tempo. Questi dati sono rappresentati in una forma di indice di valuta facile da usare e linee elettriche di valuta che puoi utilizzare per vedere il potere di questa o quella valuta. Tutto ciò di cui hai bisogno è collegare l'indicatore al grafico che
        FX Levels MT4
        Daniel Stein
        5 (2)
        FX Levels: Supporti e Resistenze di Precisione Eccezionale per Tutti i Mercati Panoramica Rapida Cercate un modo affidabile per individuare livelli di supporto e resistenza in ogni mercato—coppie di valute, indici, azioni o materie prime? FX Levels fonde il metodo tradizionale “Lighthouse” con un approccio dinamico all’avanguardia, offrendo una precisione quasi universale. Basato sulla nostra esperienza reale con i broker e su aggiornamenti automatici giornalieri più quelli in tempo reale, FX
        PRO Renko System
        Oleg Rodin
        5 (26)
        PRO Renko System è un sistema di trading altamente accurato appositamente progettato per il trading di grafici RENKO. Questo è un sistema universale che può essere applicato a vari strumenti di trading. Il sistema neutralizza efficacemente il cosiddetto rumore di mercato che consente di accedere a segnali di inversione accurati. L'indicatore è molto facile da usare e ha un solo parametro responsabile della generazione del segnale. Puoi facilmente adattare lo strumento a qualsiasi strumento di
        Golden Trend Indicator
        Noha Mohamed Fathy Younes Badr
        4.9 (10)
        Golden Trend indicator  is The best indicator for predicting trend movement this indicator never lags and never repaints and never back paints    and give  arrow buy and sell    before the candle appear  and it will help you and  will make your trading decisions clearer its work on all currencies and  gold and crypto and all time frame This unique  indicator uses very secret algorithms to catch the  trends, so you can trade using this indicator and see the trend clear on charts  manual guide and
        Scalper Vault
        Oleg Rodin
        5 (29)
        Scalper Vault è un sistema di scalping professionale che ti fornisce tutto il necessario per scalping di successo. Questo indicatore è un sistema di trading completo che può essere utilizzato dai trader di forex e opzioni binarie. L'intervallo di tempo consigliato è M5. Il sistema fornisce segnali di freccia accurati nella direzione della tendenza. Ti fornisce anche i segnali più alti e più bassi e i livelli di mercato di Gann. Gli indicatori forniscono tutti i tipi di avvisi, comprese le notifi
        Trend Screener
        STE S.S.COMPANY
        4.78 (93)
        Indicatore di tendenza, soluzione unica rivoluzionaria per il trading di tendenze e il filtraggio con tutte le importanti funzionalità di tendenza integrate in un unico strumento! È un indicatore multi-timeframe e multi-valuta al 100% non ridipingibile che può essere utilizzato su tutti i simboli/strumenti: forex, materie prime, criptovalute, indici e azioni. OFFERTA A TEMPO LIMITATO: l'indicatore di screening di supporto e resistenza è disponibile a soli 50$ e a vita. (Prezzo originale 250$) (o
        MTF Supply Demand Zones
        Georgios Kalomoiropoulos
        4.83 (23)
        Nuova generazione di zone di domanda e offerta automatizzate. Algoritmo nuovo e innovativo che funziona su qualsiasi grafico. Tutte le zone vengono create dinamicamente in base all'azione dei prezzi del mercato. DUE TIPI DI AVVISI --> 1) QUANDO IL PREZZO RAGGIUNGE UNA ZONA 2) QUANDO SI FORMA UNA NUOVA ZONA Non ottieni un altro indicatore inutile. Ottieni una strategia di trading completa con risultati comprovati.     Nuove caratteristiche:     Avvisi quando il prezzo raggiunge la zona di
        IX Power MT4
        Daniel Stein
        4.71 (7)
        IX Power: Scopri approfondimenti di mercato per indici, materie prime, criptovalute e forex Panoramica IX Power è uno strumento versatile progettato per analizzare la forza di indici, materie prime, criptovalute e simboli forex. Mentre FX Power offre la massima precisione per le coppie di valute utilizzando i dati di tutte le coppie disponibili, IX Power si concentra esclusivamente sui dati di mercato del simbolo sottostante. Questo rende IX Power una scelta eccellente per mercati non correlat
        Easy Breakout
        Mohamed Hassan
        5 (9)
        After your purchase, feel free to contact me for more details on how to receive a bonus indicator called VFI, which pairs perfectly with Easy Breakout for enhanced confluence!   Easy Breakout is a powerful price action trading system built on one of the most popular and widely trusted strategies among traders: the Breakout strategy ! This indicator delivers crystal-clear Buy and Sell signals based on breakouts from key support and resistance zones. Unlike typical breakout indicators, it levera
        Smart Set up Levels
        Mohit Dhariwal
        5 (1)
        Smart Set up leve l is a very powerful indicator based on the concept of order blocks and set up entries with proper fvg and breakouts to make a very nice level to enter like a pro trader. Very easy to use interface and friendly to enter on buy and sell signals. Works Best on M15 Time frame on Gold, Bitcoin and Fx pairs. Daily 4-5 trades on each pair  Works great on gold like a pro on M15 It is non repainting nor lagging It is very powerful indicator giving precise entries and prop acts can be c
        FX Volume
        Daniel Stein
        4.59 (34)
        FX Volume: Scopri il Vero Sentimento di Mercato dalla Prospettiva di un Broker Panoramica Rapida Vuoi portare la tua strategia di trading a un livello superiore? FX Volume ti offre informazioni in tempo reale su come i trader retail e i broker sono posizionati—molto prima che compaiano report in ritardo come il COT. Che tu miri a guadagni costanti o desideri semplicemente un vantaggio più solido sui mercati, FX Volume ti aiuta a individuare grandi squilibri, confermare i breakout e perfezionar
        Gold Trend 4
        Sergei Linskii
        Gold Trend   - è un buon indicatore tecnico azionario. L'algoritmo dell'indicatore analizza il movimento del prezzo di un asset e riflette la volatilità e le potenziali zone di ingresso. I migliori segnali dell'indicatore: - Per VENDERE = istogramma rosso + puntatore SHORT rosso + freccia di segnale gialla nella stessa direzione. - Per l'ACQUISTO = istogramma blu + puntatore LONG blu + freccia di segnale acquatica nella stessa direzione. Vantaggi dell'indicatore: 1. L'indicatore produce s
        Beast Super Signal
        Dustin Vlok
        4.73 (89)
        Alla ricerca di un potente indicatore di trading forex che possa aiutarti a identificare facilmente opportunità di trading redditizie? Non guardare oltre il Super Segnale Bestia. Questo indicatore basato sulle tendenze di facile utilizzo monitora continuamente le condizioni del mercato, cercando nuove tendenze in via di sviluppo o saltando su quelle esistenti. Il Beast Super Signal fornisce un segnale di acquisto o di vendita quando tutte le strategie interne sono allineate e sono al 100% in con
        Vi presentiamo ON Trade Waves Patterns Harmonic Elliot Wolfe, un indicatore avanzato progettato per rilevare vari tipi di pattern sul mercato utilizzando metodi sia manuali che automatici. Ecco come funziona: Pattern Armonici: Questo indicatore è in grado di individuare pattern armonici che appaiono sul vostro grafico. Questi pattern sono fondamentali per i trader che praticano la teoria del trading armonico, come descritta nel libro di Scott Carney "Harmonic Trading vol 1 & 2". Che li disegniat
        System Trend Pro
        Aleksandr Makarov
        5 (2)
        System Trend Pro - This is the best trend trading indicator!!! The indicator no repaint!!!  The indicator has   MTF   mode, which adds confidence to trading on the trend (   no repaint   ). How to trade? Everything is very simple, we wait for the first signal (big arrow), then wait for the second signal (small arrow) and enter the market in the direction of the arrow. (See screens 1 and 2.) Exit on the opposite signal or take 20-30 pips, close half of it, and keep the rest until the opposite s
        M1 Arrow
        Oleg Rodin
        5 (16)
        Una strategia intraday basata su due principi fondamentali del mercato. L'algoritmo si basa sull'analisi dei volumi e delle onde di prezzo utilizzando filtri aggiuntivi. L'algoritmo intelligente dell'indicatore fornisce un segnale solo quando due fattori di mercato si combinano in uno solo. L'indicatore calcola le onde di un certo intervallo sul grafico M1 utilizzando i dati dell'intervallo di tempo più alto. E per confermare l'onda, l'indicatore utilizza l'analisi per volume. Questo indicatore
        FX Power MT4 NG
        Daniel Stein
        4.94 (18)
        FX Power: Analizza la Forza delle Valute per Decisioni di Trading Più Intelligenti Panoramica FX Power è lo strumento essenziale per comprendere la reale forza delle principali valute e dell'oro in qualsiasi condizione di mercato. Identificando le valute forti da comprare e quelle deboli da vendere, FX Power semplifica le decisioni di trading e rivela opportunità ad alta probabilità. Che tu segua le tendenze o anticipi inversioni utilizzando valori estremi di Delta, questo strumento si adatta
        Advanced Supply Demand
        Bernhard Schweigert
        4.91 (294)
        CURRENTLY 26% OFF !! Best Solution for any Newbie or Expert Trader! This indicator is a unique, high quality and affordable trading tool because we have incorporated a number of proprietary features and a new formula. With this update, you will be able to show double timeframe zones. You will not only be able to show a higher TF but to show both, the chart TF, PLUS the higher TF: SHOWING NESTED ZONES. All Supply Demand traders will love it. :) Important Information Revealed Maximize the potentia
        MetaBands M4
        Vahidreza Heidar Gholami
        5 (3)
        MetaBands uses powerful and unique algorithms to draw channels and detect trends so that it can provide traders with potential points for entering and exiting trades. It’s a channel indicator plus a powerful trend indicator. It includes different types of channels which can be merged to create new channels simply by using the input parameters. MetaBands uses all types of alerts to notify users about market events. Features Supports most of the channel algorithms Powerful trend detection algorith
        Enigmera
        Ivan Stefanov
        5 (7)
        ENIGMERA: Il cuore del mercato Importante: La demo di MQL5.com funziona nel Strategy Tester e potrebbe non riflettere completamente le funzionalità di Enigmera. Consulta la descrizione, gli screenshot e il video per maggiori dettagli. Non esitare a inviarmi un messaggio se hai domande! Il codice dell'indicatore è stato completamente riscritto. La versione 3.0 aggiunge nuove funzionalità e corregge i bug accumulati dall'inizio dell'indicatore. Introduzione Questo indicatore e sistema di trading
        Apollo BuySell Predictor è un sistema di trading professionale che include diversi moduli di trading. Fornisce a un trader zone di breakout uniche, livelli di supporto e resistenza basati su Fibonacci, linea di tendenza pivot, segnali di volume di pullback e altre funzioni utili di cui ogni trader ha bisogno su base giornaliera. Il sistema funzionerà con qualsiasi coppia. I tempi consigliati sono M30, H1, H4. Sebbene l'indicatore possa funzionare anche con altri intervalli di tempo, ad eccezione
        Blahtech Supply Demand
        Blahtech Limited
        4.64 (36)
        Was: $299  Now: $149   Supply Demand uses previous price action to identify potential imbalances between buyers and sellers. The key is to identify the better odds zones, not just the untouched ones. Blahtech Supply Demand indicator delivers functionality previously unavailable on any trading platform. This 4-in-1 indicator not only highlights the higher probability zones using a multi-criteria strength engine, but also combines it with multi-timeframe trend analysis, previously confirmed swings
        Scopri il segreto per il trading Forex di successo con il nostro indicatore MT4 personalizzato! Ti sei mai chiesto come raggiungere il successo nel mercato Forex, guadagnando costantemente profitti minimizzando il rischio? Ecco la risposta che hai cercato! Permettici di presentare il nostro indicatore MT4 proprietario che rivoluzionerà il tuo approccio al trading. Versatilità unica Il nostro indicatore è appositamente progettato per gli utenti che preferiscono le formazioni di candele Renko e
        Altri dall’autore
        UPD1 Volume BOX
        Vitaliy Kuznetsov
        4.93 (15)
        L'indicatore mostra il profilo del volume orizzontale nell'area specificata (BOX) e il volume massimo (POC). Caratteristiche del prodotto. 1. Puoi usare i tick o solo il prezzo. 2. Spaziatura della griglia adattiva (M1-MN). 3. Fase di ricerca adattiva ad alto volume (mediana) a seconda delle dimensioni della casella. 4. Colore camaleonte automatico per linee di scatole e pulsanti. 5. Caselle multiple, facili da creare ed eliminare. 6. Area del volume del 70% (abilitata nelle impostazioni). 7. È
        UPD1 Pin Bar Dashboard
        Vitaliy Kuznetsov
        5 (3)
        L'indicatore visualizza il modello di candela della barra Pin. Le impostazioni del rapporto consentono di regolare facilmente il rapporto tra ombra, corpo e dimensione. È possibile filtrare per tendenza (2 medie mobili) e per inversione (RSI e bande di Bollinger). Questo è il modello più popolare di Price Action. Disponibile cruscotto multivaluta. Con esso, puoi passare facilmente da un grafico all'altro. Modelli di trading: Retest per tendenza. Falsa ripartizione. Terzo. EURUSD, GBPUSD, XAUU
        UPD1 Profile Levels
        Vitaliy Kuznetsov
        5 (5)
        L'indicatore trova i livelli del volume di prezzo massimo e minimo (profilo di mercato) nell'istogramma di lavoro per il numero specificato di barre.   Profilo composito. L'altezza dell'istogramma è completamente automatica e si adatta a qualsiasi strumento e periodo di tempo. Viene utilizzato l'algoritmo dell'autore e non ripete analoghi noti. L'altezza dei due istogrammi è approssimativamente uguale all'altezza media della candela. Smart alert (smart alert) ti aiuta a comunicare il prezzo rel
        Lo scopo di questo indicatore è trovare i livelli di Murray su tutti i timeframe e combinarli in livelli combo che includono livelli di segnale basati su forti livelli di Murray (+2, +1, 8, 4, 0, -1, -2). Più piccolo è il timeframe, maggiori sono le possibilità di vedere immediatamente il livello combo. Sarà evidenziato in colore. Se si posiziona il cursore su un numero qualsiasi, apparirà un tooltip che indicherà a quale timeframe appartiene il livello. Tuttavia, il timeframe corrente sarà semp
        Pannello di trading con ordini preimpostati e calcolo automatico del lotto per il terminale MT4. Attenzione, il Trading Panel non funziona nel tester della strategia (solo il test del trailing stop). Manuale, Descrizione, Download Light Demo. I trader di successo si distinguono per l'autodisciplina e la gestione competente. Se usi un lotto fisso, allora sei a rischio. Dopotutto, in diversi intervalli di tempo, una distanza diversa e una transazione in perdita possono bloccare diversi profitti. S
        Lo scopo di questo indicatore è trovare i livelli di Murray su tutti i timeframe e combinarli in livelli combo che includono livelli di segnale basati su forti livelli di Murray (+2, +1, 8, 4, 0, -1, -2). Più piccolo è il timeframe, maggiori sono le possibilità di vedere immediatamente il livello combo. Sarà evidenziato in colore. Se si posiziona il cursore su un numero qualsiasi, apparirà un tooltip che indicherà a quale timeframe appartiene il livello. Tuttavia, il timeframe corrente sarà semp
        UPD1 Volume Pixel
        Vitaliy Kuznetsov
        5 (3)
        L'indicatore Trova il volume basso, alto, estremo in base ai coefficienti specificati e li colora nei colori specificati. Sostituisce la funzione di disegno del volume standard nel terminale metatrader. Le candele possono anche essere dipinte nel colore del volume. Sulle candele con volume estremo, viene determinato il volume orizzontale massimo (cluster/POC). A seconda della sua posizione (spinta, neutro, arresto), il cluster ha anche il suo colore. Se il cluster è in ombra e la candela ha un
        UPD1 Trend Direction
        Vitaliy Kuznetsov
        4.75 (8)
        Questo indicatore viene utilizzato per visualizzare le posizioni piatte e di tendenza. Il design si basa su un oscillatore. Viene utilizzato come filtro aggiuntivo, sia per il trading su un grafico normale che per le opzioni binarie. Le posizioni piatte vengono utilizzate nell'indicatore UPD1 volume Cluster per il trading secondo il concetto di Smart Money. Un avviso incorporato segnala i luoghi più ipercomprati / ipervenduti. Parametri di input. Impostazioni di base. Bars Count - specificare
        FREE
        UPD1 Volume Cluster
        Vitaliy Kuznetsov
        4.79 (14)
        L'algoritmo trova le zone di volatilità ridotta in base all'indicatore UPD1 Trend Direction e traccia il volume orizzontale massimo in base all'indicatore UPD1 Volume Box . Di norma, un forte movimento di tendenza si verifica quando si esce dall'accumulo. Se il prezzo ha lasciato l'accumulo, può testare il suo volume orizzontale massimo (POC). Smart Alert sono disponibili nelle impostazioni. Parametri di input. Impostazioni di base. Bars Count – numero di barre della cronologia su cui verrà e
        FREE
        L'indicatore costruisce un semaforo a tre periodi e un pattern di inversione 123 dall'estremo. Il segnale arriva all'apertura della seconda candela. Questo pattern può essere negoziato in diversi modi (test point 3, breakout e altri). L'uscita dal canale o il breakout della trendline è il principale fattore scatenante per trovare un punto di ingresso. Le icone sono colorate in base ai livelli di Fibonacci. Le icone gialle indicano il test di un livello al quale il segnale è amplificato. Utilizz
        UPD1 Volume Footer
        Vitaliy Kuznetsov
        4.83 (12)
        L'indicatore mostra il volume verticale. Nelle impostazioni ci sono 2 fattori per determinare l'alto e l'estremo e 1 per determinare il basso volume. Un algoritmo simile viene utilizzato anche nell'indicatore UPD1 Volume Pixel . Quando viene rilevato un volume specificato, l'istogramma viene colorato nel colore corrispondente. La larghezza dell'istogramma viene selezionata automaticamente, a seconda della scala. Di norma, il prezzo reagisce al volume massimo e minimo. Ma è necessario utilizzare
        FREE
        UPD1 Volume TimeFrame POC
        Vitaliy Kuznetsov
        4.25 (4)
        L'indicatore visualizza il volume orizzontale massimo nel periodo di tempo selezionato. Basato sull'indicatore UPD1 Volume Box . Le linee possono essere collegate o separate. Nelle impostazioni, è possibile abilitare l'avviso Smart Touch. Tale indicatore sarà utile per coloro che commerciano utilizzando il profilo di mercato e il concetto di Smart Money. Parametri di input. Impostazioni di base. Bars Count - specifica il numero di barre su cui verrà disegnato TF POC. Data Source - periodo di
        FREE
        UPD1 Fibo Levels
        Vitaliy Kuznetsov
        5 (1)
        L'indicatore analizza il numero di candele specificato e costruisce i livelli di Fibonacci in base al massimo e al minimo. Poiché i livelli vengono ricostruiti, siamo interessati al lato destro dell'intervallo. Il prezzo è magnetico rispetto ai livelli e reagisce a un tocco. Utilizzate questo strumento per trovare un punto di ingresso nel trend dopo una correzione. Se a sinistra vediamo che i livelli sono perfettamente al rialzo, allora possiamo presumere di aver trovato la fine del movimento ne
        FREE
        UPD1 X00 Levels
        Vitaliy Kuznetsov
        5 (8)
        L'indicatore mostra livelli circolari sul grafico. Sono anche chiamati livelli psicologici, bancari o dei principali operatori. A questi livelli si verifica una vera e propria lotta tra tori e orsi, l'accumulo di molti ordini, che porta a un aumento della volatilità. L'indicatore si adatta automaticamente a qualsiasi strumento e timeframe. Se il livello 80 viene rotto e poi testato, acquistare. Se il livello 20 viene rotto e poi testato, vendere. L'obiettivo è 00. Attenzione. A causa dei forti
        FREE
        UPD1 Rsi Dots Dashboard
        Vitaliy Kuznetsov
        5 (1)
        L'indicatore mostra segnali basati sull'oscillatore RSI terminale sul grafico. È possibile filtrare i segnali ripetuti. Qui l'oscillatore viene utilizzato per cercare un segnale inverso. È raccomandato come punto di ingresso nelle strategie swing e nel trading dai livelli. È disponibile una dashboard multi-valuta. Con esso, puoi facilmente passare da un grafico all'altro. Nelle discussioni sui prodotti, è possibile suggerire un algoritmo in cui è possibile incorporare un dashboard. Parametri
        FREE
        UPD1 Profile Levels MT5
        Vitaliy Kuznetsov
        5 (3)
        L'indicatore trova i livelli del volume di prezzo massimo e minimo (profilo di mercato) nell'istogramma di lavoro per il numero specificato di barre.   Profilo composito. L'altezza dell'istogramma è completamente automatica e si adatta a qualsiasi strumento e periodo di tempo. Viene utilizzato l'algoritmo dell'autore e non ripete analoghi noti. L'altezza dei due istogrammi è approssimativamente uguale all'altezza media della candela. Smart alert (smart alert) ti aiuta a comunicare il prezzo rela
        UPD1 Watermark MT4
        Vitaliy Kuznetsov
        5 (1)
        L'indicatore visualizza qualsiasi testo e qualsiasi immagine sul grafico e può anche visualizzare le informazioni richieste dalle macro. Sono disponibili tre blocchi di testo e un blocco per le immagini. Sono disponibili la selezione dei caratteri, la dimensione, il colore, l'indentazione e il posizionamento. Se si desidera marcare le schermate o visualizzare le informazioni richieste su un grafico, UPD1 Watermark sarà uno strumento molto utile. Descrizione delle impostazioni. Impostazioni de
        FREE
        L'indicatore mostra livelli circolari sul grafico. Sono anche chiamati livelli psicologici, bancari o dei principali operatori. A questi livelli si verifica una vera e propria lotta tra tori e orsi, l'accumulo di molti ordini, che porta a un aumento della volatilità. L'indicatore si adatta automaticamente a qualsiasi strumento e timeframe. Se il livello 80 viene rotto e poi testato, acquistare. Se il livello 20 viene rotto e poi testato, vendere. L'obiettivo è 00. Attenzione. A causa dei forti
        FREE
        UPD1 Murrey Math Levels
        Vitaliy Kuznetsov
        5 (6)
        I livelli matematici di Murray si basano sulle osservazioni di Gann e sulla sua teoria della quadraticità dei prezzi. Secondo Gunn, il prezzo si muove in intervalli di 1/8. Questi 1/8 ci permettono di ottenere diversi livelli di resistenza e supporto per un dato grafico, che hanno le loro caratteristiche. Quando i livelli -2 o +2 vengono rotti o quando la volatilità diminuisce, vengono ricostruiti. È possibile scegliere il periodo da visualizzare (corrente o tutta la storia). Tutte le linee son
        FREE
        L'Average True Range ( ATR ) è una misura della volatilità del mercato in un determinato numero di giorni. Non ci si deve aspettare un grande movimento di continuazione quando il prezzo ha raggiunto la fine del range. Si ritiene che il mercato abbia esaurito il carburante. Se il prezzo non ha raggiunto il limite, ha ancora un margine di movimento. La formula dell'indicatore consente di calcolare i livelli High-Low sia in aggregato che singolarmente. È inoltre possibile utilizzare questi livelli
        FREE
        Un indicatore che visualizza il pattern candela inghiottendo. Nelle impostazioni, è possibile specificare il tipo di engulfing (corpo, ombra e combinazione). È possibile filtrare per tendenza (2 medie mobili) e per inversione (RSI e Bande di Bollinger). Questo è un modello di azione dei prezzi molto popolare. È disponibile una dashboard multi-valuta. Con esso, puoi facilmente passare da un grafico all'altro. Modelli di trading: Ripetere il test per tendenza. Falso breakout. Blocco ordine. Altr
        UPD1 D Levels
        Vitaliy Kuznetsov
        5 (1)
        L'indicatore dei livelli si basa sui dati del giorno precedente. La formula matematica determina i livelli di entrata e di uscita.  Raccomandazioni di trading. I livelli vengono negoziati all'inizio della sessione europea, quando appare la volatilità. In caso di volatilità insufficiente, utilizzare metà del take profit per uscire. Se il prezzo si è invertito a metà del take profit, allora sull'inversione cercate un target anche al livello di metà del take profit. Se il prezzo rimbalza dal live
        FREE
        UPD1 Impulse Channel
        Vitaliy Kuznetsov
        5 (8)
        Un canale non disegnato per il trading di tendenza. È costruito dall'ATR e ha un limite di volatilità opposto. L'indicatore si è dimostrato valido nella strategia sui livelli di impulso e sui falsi breakout. Il punto di ingresso va cercato sulla correzione della linea dell'indicatore e il take profit va fissato sul confine opposto. Blog-Link -   Retest and Fake Breakout with UPD1 . Parametri di ingresso. Bars Count   - cronologia da visualizzare. ATR   - periodo di calcolo. Coefficient   - co
        FREE
        UPD1 Pivot Levels
        Vitaliy Kuznetsov
        5 (1)
        L'indicatore mostra i classici livelli di pivot sul grafico, calcolati sulla base del giorno precedente. È possibile scegliere da quale ora calcolare la formula. Scambiate in un mercato piatto per l'inversione. In un mercato in trend, utilizzateli come target. Combinateli con le vostre strategie per un trading di successo. I livelli vengono costruiti utilizzando i buffer e visualizzati sull'intero storico delle quotazioni disponibili. Parametri di input. Start Hour - da quale ora considerare
        FREE
        UPD1 Impulse Level
        Vitaliy Kuznetsov
        5 (7)
        L'indicatore trova le onde impulsive sul grafico. Analizza la rottura del canale frattale e costruisce i livelli di impulso.  Inoltre, Trova i luoghi presunti Di false rotture e sequestro di liquidità. Nelle impostazioni, è possibile abilitare il dashboard multivaluta e selezionare qualsiasi strumento e intervallo di tempo. Avviso scegli tra il programma corrente o l'intero elenco. Ci sono segnali separati di impulso e falsa rottura. Blog-Link -  Retest and Fake Breakout with UPD1 . Modelli d
        L'indicatore Cerca e visualizza automaticamente grandi ombre sul grafico in base alla volatilità. Le ombre sono ulteriormente filtrate dalla dimensione dell'onda. L'algoritmo analizza la rottura del frattale con un'ombra nell'intervallo specificato e visualizza il livello. Nelle impostazioni, è possibile abilitare il dashboard multi-valuta. L'avviso viene scelto tra il grafico corrente o l'intero foglio del dashboard. Segnali a grandi ombre e quelli che hanno sfondato il livello frattale posson
        L'indicatore visualizza il modello "Rails" sul grafico. Questo schema consiste in due candele multidirezionali con corpi identici e piccole ombre. Se sul timeframe corrente il pattern "Rails", sul timeframe x2 apparirà come una Pin Bar (Doji). Questo indicatore è stato creato per trovare automaticamente il pattern nel modo più efficiente, con impostazioni logicamente semplici che possono essere facilmente modificate. È possibile filtrare in base alla tendenza (2 medie mobili) e all'inversione (
        L'indicatore mostra un segnale sul grafico quando la seconda candela è all'interno della prima, cioè non ha superato i suoi limiti. Questo modello di candela è chiamato Inner Bar. Questo schema non è così popolare come la Pin Bar o il Engulfing, ma viene talvolta utilizzato da alcuni trader. Esiste la possibilità di filtrare per tendenza (2 medie mobili) e per inversione (RSI e Bande di Bollinger). È disponibile un pannello multivaluta. Con il suo aiuto è possibile passare facilmente da un graf
        L'indicatore costruisce un semaforo a tre periodi e un pattern di inversione 123 dall'estremo. Il segnale arriva all'apertura della seconda candela. Questo pattern può essere negoziato in diversi modi (test point 3, breakout e altri). L'uscita dal canale o il breakout della trendline è il principale fattore scatenante per trovare un punto di ingresso. Le icone sono colorate in base ai livelli di Fibonacci. Le icone gialle indicano il test di un livello al quale il segnale è amplificato. Utilizz
        Filtro:
        Nessuna recensione
        Rispondi alla recensione
        Versione 3.82 2025.01.01
        compiled on new terminal build
        copyright 2025
        Versione 3.81 2023.12.23
        minor bugs fixed
        added dark dashboard theme (select automatically or manually)
        compiled a new build 1400
        Versione 3.22 2023.06.25
        fix wingdings object name
        Versione 3.20 2022.09.22
        fixed some bugs
        completely redone dashboard:
        + one dashboard with all its elements - 1 object
        + responsive design
        + drag and drop works on any part
        + does not conflict with other dashboards
        + when interacting, it is displayed on the front layer
        + saves its last location when switching/restarting the terminal, including when using templates
        + each cell is calculated separately
        + does not count all cells again when switching a currency pair (fast switching)
        Versione 3.12 2022.05.31
        Fixed working with the template when the dashboard is enabled
        Versione 3.11 2022.05.20
        New dashboard:
        + any size, support 4k
        + completely new graphics and object interaction

        General code improvements