ADR Alert Dashboard
- Indicatori
- LEE SAMSON
- Versione: 1.20
- Aggiornato: 3 maggio 2021
- Attivazioni: 10
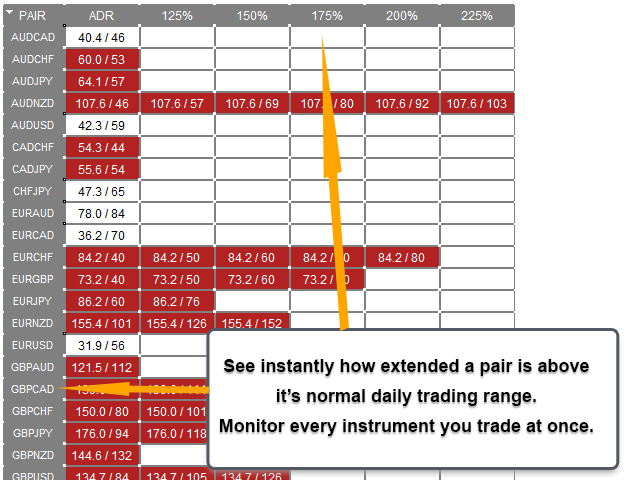
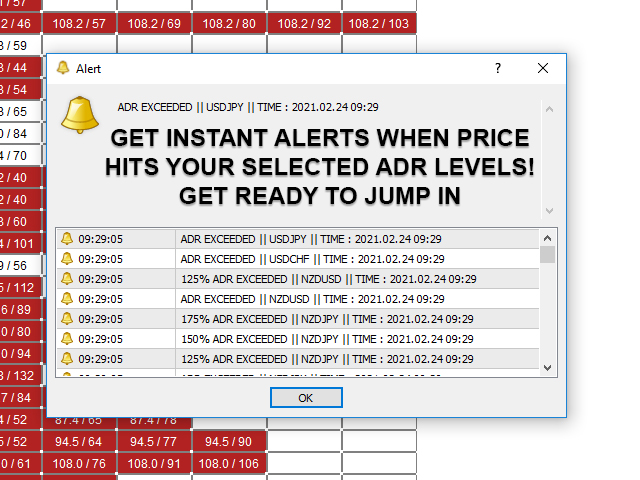
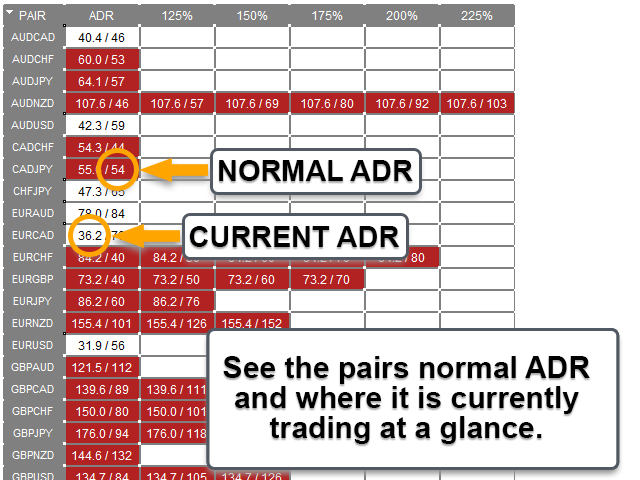
Il dashboard di avviso ADR ti mostra a colpo d'occhio dove il prezzo è attualmente scambiato in relazione al suo normale intervallo medio giornaliero. Riceverai avvisi istantanei tramite pop-up, e-mail o push quando il prezzo supera la sua gamma media e livelli superiori a tua scelta in modo da poter saltare rapidamente a pullback e inversioni. Il trattino è progettato per essere posizionato su un grafico vuoto e semplicemente sedersi in background e avvisarti quando i livelli vengono raggiunti, quindi non è necessario sederti e guardarlo o addirittura guardarlo!
VERSIONE MT5 DISPONIBILE QUI: https://www.mql5.com/en/market/product/66316
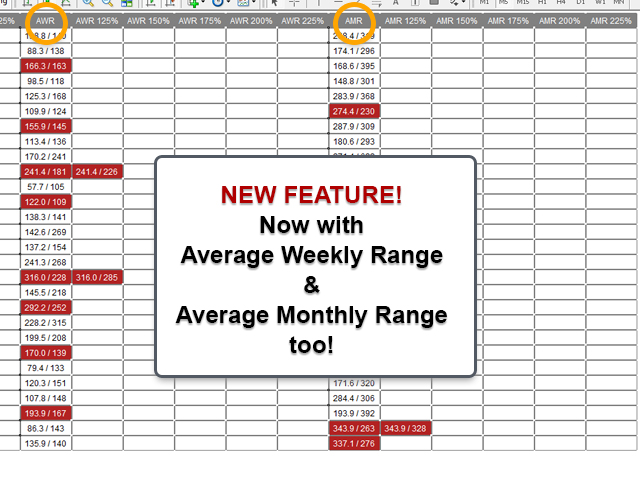
NOVITÀ: ora ti mostra anche gli intervalli medi SETTIMANALI e MENSILI e avvisi anche per loro!
RICEVI L'INDICATORE DI INVERSIONE ADR CHE DISEGNA I LIVELLI DELLA TUA CARTA ANCHE QUI: https://www.mql5.com/en/market/product/62757
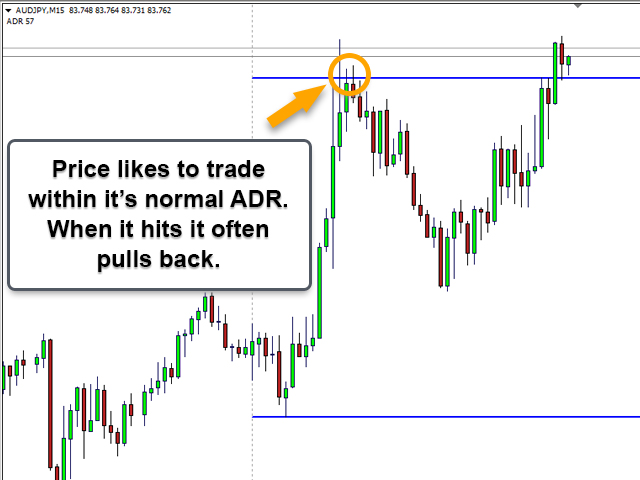
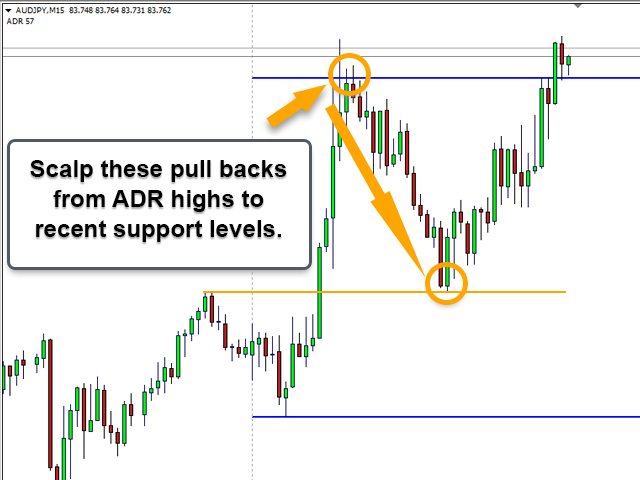
Circa il 60% delle volte il prezzo viene scambiato all'interno del suo normale intervallo giornaliero medio (ADR) e le spinte al di sopra di questi livelli sono solitamente un indicatore di un forte movimento di prezzo che in genere avrà un movimento di ritiro (presa di profitto) che lo segue. Puoi trarre vantaggio da queste mosse brusche scambiando il pullback dalla parte superiore o inferiore dell'intervallo giornaliero al livello più recente di supporto o resistenza.
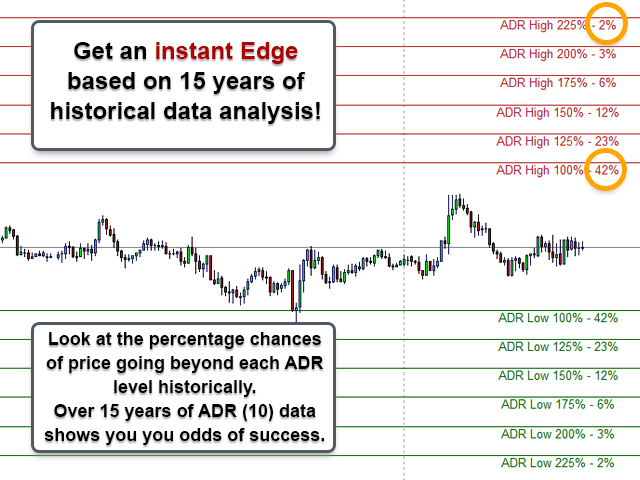
Sono stati raccolti oltre 20 anni di dati storici per trovare le possibilità percentuali medie che il prezzo si sposti oltre i livelli ADR specifici per le principali coppie forex e una selezione di incroci. Questi dati hanno indicato che il prezzo si è spostato solo oltre il 200% del suo ADR il 3% delle volte, il che significa che le tue probabilità di un'inversione o un ritiro a quel livello sarebbero del 97%!!!
Queste le medie di estensione ADR mostrate dai dati:
Il prezzo ha superato il 100% di ADR10 circa il 42% delle volte.
Il prezzo ha superato il 125% di ADR10 circa il 23% delle volte.
Il prezzo ha superato il 150% di ADR10 circa il 12% delle volte.
Il prezzo ha superato il 175% di ADR10 circa il 6% delle volte.
Il prezzo ha superato il 200% di ADR10 circa il 3% delle volte.
Il prezzo ha superato il 225% di ADR10 circa il 2% delle volte.
Come puoi vedere dai livelli sopra, se il prezzo arriva al 150% del suo normale ADR, le probabilità che vada oltre sono solo del 12%, dandoti un enorme vantaggio. Attendi che l'azione dei prezzi ti mostri i segni di una svolta a quel livello e salta sul pullback!
Impostazioni dashboard:
Regola la posizione della dashboard e cambia le dimensioni delle caselle e del testo.
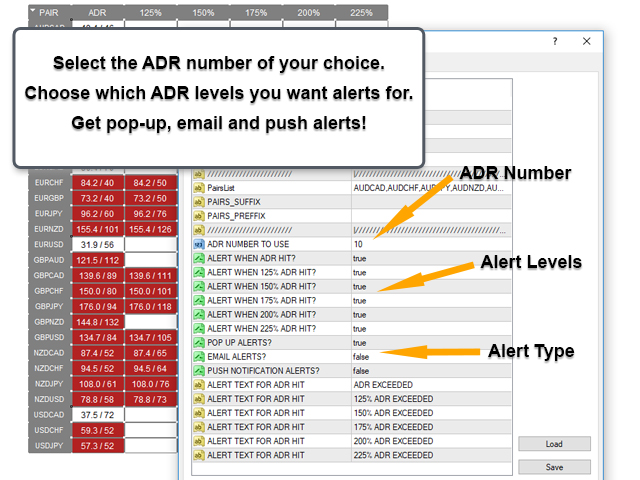
Seleziona le coppie che desideri monitorare e inserisci il prefisso o il suffisso del broker, se necessario.
Selezionare quale numero ADR utilizzare per i livelli (ADR10 è l'impostazione predefinita e su cosa si basa l'analisi dei dati).
Scegli a quali livelli vorresti essere avvisato quando colpito.
Seleziona il tipo di avvisi che desideri ricevere da popup, e-mail o avvisi push.
Scegli l'avviso di testo che desideri per ogni livello.
Idea per la strategia di ingresso:
Attendi che il prezzo raggiunga un livello specifico e ricevi un avviso. Più alto è il livello, maggiori sono le possibilità di inversione, ma meno avvisi riceverai. Quando ricevi un avviso puoi aspettare che si formi un buon pattern di candele con azione sui prezzi (inghiottimento, martello, stella cadente ecc...) oppure potresti voler usare un EMA stretto come EMA9 e saltare dentro. M5 o M15 sono i tempi migliori da utilizzare.
Per ottenere i migliori risultati, attendi un'interruzione confermata nella struttura del mercato sul grafico M5 utilizzando l'indicatore degli avvisi di inversione di mercato. (disponibile qui: https://www.mql5.com/en/market/product/46295)
Queste operazioni dovrebbero essere operazioni di scalping, quindi idealmente mirano al massimo o al minimo più recente che potrebbe fungere da livello di supporto o resistenza. Spesso questi avvisi ADR si verificano nelle sessioni di Londra o di New York, quindi è spesso una buona idea prendere di mira gli alti e bassi della sessione asiatica.


Handy indicator, reliable and easy to use.