ATR RSI i4
- Indicatori
- Aleksander Gladkov
- Versione: 1.2
- Aggiornato: 2 marzo 2021
- Attivazioni: 5
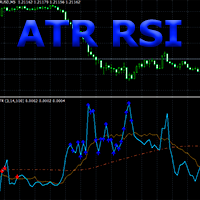
Composition of ATR and RSI indicators.
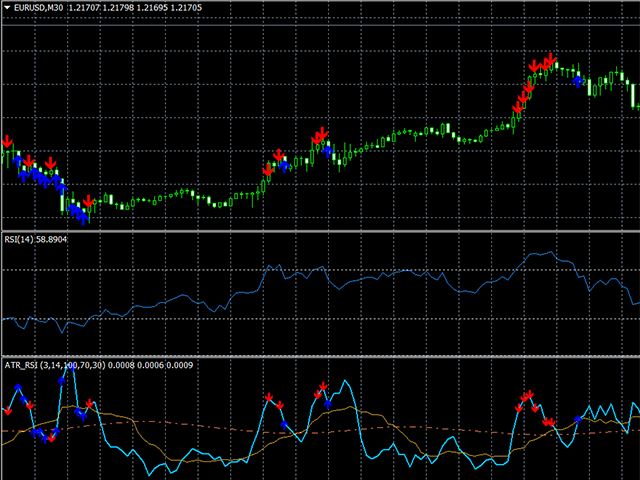
The ATR RSI indicator compares two calculations of the ATR indicator with the Fast and Slow periods on one chart, plus the line of the average and the overbought and oversold zones of the RSI indicator.
ATR shows the values of the volatility change in the currency pair in points, taking into account the period specified as a parameter.
The entry points provided by the RSI indicator show a very good risk-reward ratio in volatile and trending markets.
ATR RSI indicator reveals the possibilities of each indicator in their interaction.
The ATR RSI x4 Expert Advisor works according to the indicator signals.
The indicator generates buy and sell signals when the current level of the RSI indicator hits the overbought or oversold zones.
Two values of the RSI indicator are analyzed: current and previous.
For the overbought zone: if the current is greater than the previous one, then sell, if, on the contrary, buy.
For the oversold zone: if the current is less than the previous one, then buy, if on the contrary - sell.
If the value of the Step RSI sublevels (0 - not use) parameter is greater than zero, then the comparison of values is taken into account only if the current and previous RSI indicators are at different sublevels.
Filters can be applied to signals depending on the values of the corresponding parameters.
- Use ATR Fast signal filter = true
- Use ATR Slid signal filter = true
- Use Previous signal filter = true
- ATR indicator line for a period value equal to the Fast period ATR parameter
- ATR indicator line for a period value equal to the ATR Slow period parameter
- The average ATR line, calculated according to the specified parameters of the Sliding method and the Sliding period of the Slow line (when it is broken, the most significant price movements occur.)
- Arrows of the RSI indicator, marking the breakout of the Overbought or Oversold levels, depending on the chosen strategy Use Strategy = Both, BUYOverSold_SELLOverBought, SELLOverSold_BUYOverBought (can be displayed on the main chart of the currency pair movement)
Options
------- Strategy -------
Use Strategy = Both; // Both, BUYOverSold_SELLOverBought, SELLOverSold_BUYOverBought
Step RSI sublevels (0 - not use) = 0;
Use ATR Fast signal filter = true;
Use ATR Slid signal filter = true;
Use Previous signal filter = true;
------- ATR -------
Fast period ATR = 3;
Slow period ATR = 14;
Sliding period = 100;
Sliding method = MODE_EMA;
------- RSI -------
RSI period = 14;
RSI applied price = PRICE_CLOSE;
Overbought level = 70;
Oversold level = 30;
Draws arrows on chart = true;
