• Panoramica
  • Recensioni (18)
  • Commenti (134)
  • Novità

VR ATR Pro

4.33

VR ATR Pro is a powerful professional tool for determination of target levels on a financial instrument. The indicator's effectiveness has been proved by thousands tests on real and demo accounts.

VR ATR Pro is the indicator that works on real data using live true statistics. Statistics is stubborn, the usage of real statistical data in mathematical calculations allows you to calculate the exact target levels for a financial instrument.

Per una serie di file, istruzioni e un bel bonus scrivimi

Advantages

The indicator has a number of advantages, here are just some of them:

  • High accuracy of the indicator.
  • You can exclude paranormal bar from calculations.
  • Simple display of target levels directly on the business chart.
  • Works with any financial instruments (Forex, Metals, CFD, Futures, Crypto).
  • Does not redraw, constantly saves its readings.
  • Effective for determination of Stop Loss and Take Profit levels.
  • Smartphone notifications, e-mail and MetaTrader alert.
  • The versions for MetaTrader 4 and MetaTrader 5 are exactly the same.
  • Easy to set up and install.
  • Good for beginners and experienced traders.
  • Works on all periods and time frames.

Recommendations

  • The period for calculating the indicator must be less than the Timeframe of the indicator.
  • Use the calculation of the settings readings accuracy for new financial instruments.
  • Use the indicator to calculate the levels on daily periods or periods longer than daily.
  • Use the indicator along with your trading system.
  • Place Take Profit inside the levels, and Stop Loss outside the levels.
  • Use a calculation period greater than 10 to get the most accurate results.
  • It is recommended to avoid trading if the price has reached the level calculated by the indicator.

Algorithm of work

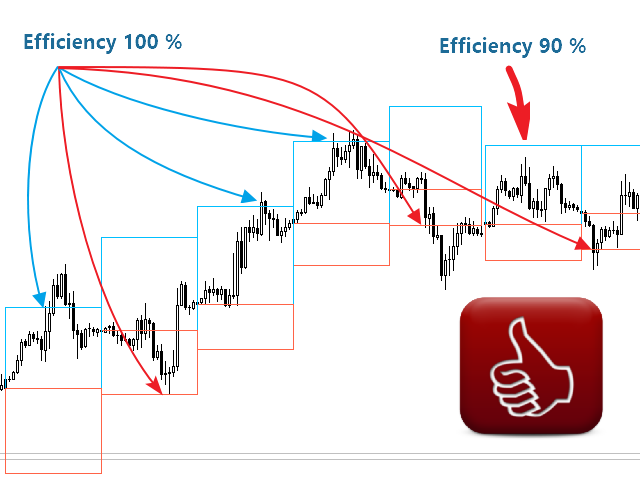
The algorithm of the indicator is based on the mathematical calculation of the average price behaviour for a specified period of time. The period indicator “detects” and memorizes the number of points passed for the period. Then the indicator, on the base of the mathematical formula of the average price, calculates the levels for forecasting price growth and for forecasting price falling.

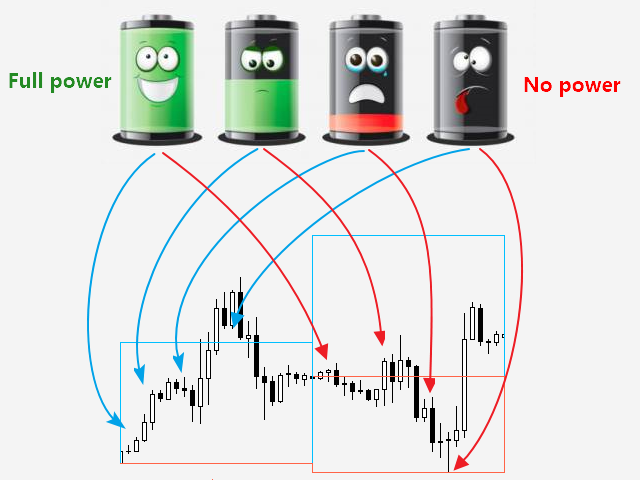
Thanks to such use of the real data, the indicator does not redraw and shows high accuracy. The indicator can be compared to the current charge in the battery of your phone. You know that on average, your phone loses its charge after 12-16 hours of use. Likewise, VR ATR Pro calculates the level, if the day before yesterday the price passed 50 points, yesterday the price passed 60 points, today 55, then tomorrow the probability that the price will pass 55 points on average is almost 99%.

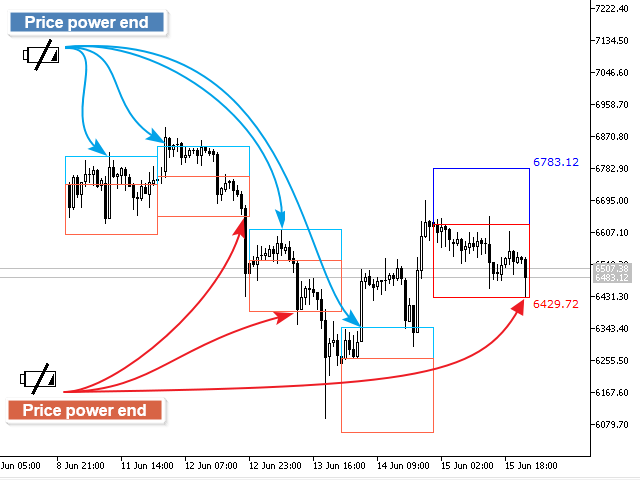
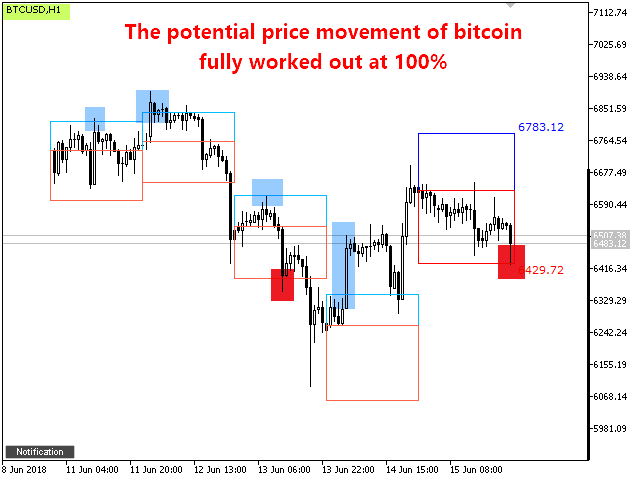
Program displays two levels on the business chart:

  • The upper level is the predicted level of the price increase
  • The lower level is the predicted level of the price decrease

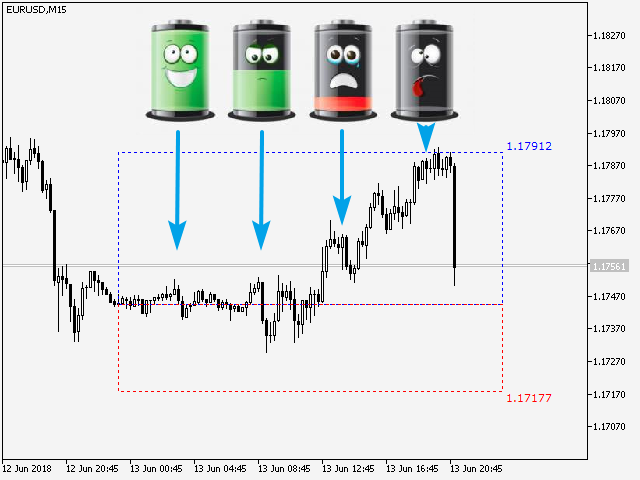
Levels can be displayed as areas with deviations from the exact level. This allows to calculate the prices within the range of statistical deviation.

Accuracy of the readings

The program does not show the signals for buying or selling a financial instrument. VR ATR Pro calculates the target levels to which the price strives, the levels for which the price has enough strength and energy to reach. These levels can be used to set Stop Loss and Take Profit values. To calculate the accuracy of the indicator, it is recommended to make a calculation according to the principle of how many times in history the price reached the levels calculated by the indicator. In this way we will find out the accuracy of the indicator.

Conditions for calculating the accuracy of VR ATR Pro

  • 5 signs after the decimal point
  • 100 periods for calculation
  • The period for calculating levels - 10
  • Timeframe for calculating - One day
  • Calculation dates 10/18/2019 - 03/09/2020
  • Timeframe of indicator display - 1 hour
  • EUR / USD Reading accuracy 88%
  • GBP / USD Reading Accuracy 78%
  • BTC / USD Reading Accuracy 75%

Versione per: MetaTrader 5

Il tuo feedback è il miglior ringraziamento per noi! Lascia una recensione.

Maggiori informazioni in blog.

Recensioni 18
David T
288
David T 2023.11.11 23:55 
 

Very useful indicator but as most indicators it is not meant to be used as a stand alone but as a confirmation . This indicator helps confirm of the market is breakout out or trending sideways. Still testing it but so far pleased with my purchase.

Yuriskam
206
Yuriskam 2023.06.21 04:44 
 

Этот индикатор будет полезен всем!

elite luis
3351
elite luis 2023.04.03 03:49 
 

Looks Good and Author is responsive supportive, 5 stars for now, Thank you :)

Prodotti consigliati
Blahtech Market Profile
Blahtech Limited
4.56 (16)
Was: $249  Now: $99   Market Profile defines a number of day types that can help the trader to determine market behaviour. A key feature is the Value Area, representing the range of price action where 70% of trading took place. Understanding the Value Area can give traders valuable insight into market direction and establish the higher odds trade. It is an excellent addition to any system you may be using. Blahtech Limited presents their Market Profile indicator for the MetaTrader community. Ins
Daily Candle Predictor è un indicatore che prevede il prezzo di chiusura di una candela. L'indicatore è destinato principalmente all'uso sui grafici D1. Questo indicatore è adatto sia per il trading forex tradizionale che per il trading di opzioni binarie. L'indicatore può essere utilizzato come sistema di trading autonomo o può fungere da aggiunta al sistema di trading esistente. Questo indicatore analizza la candela corrente, calcolando alcuni fattori di forza all'interno del corpo della cande
Simply The Best Pro
Szymon Palczynski
5 (1)
This indicator displays the histogram and arrows on chart. When Simple The Best Pro are placed on a chart, they identify the trend.  The color of may be blue or red. The blue color stands for upside moves and the red color stands for downside trends. The indicator offers to set Stop Loss (SL) and  Take Profit (TP)  setting. The default value is ATR. Indicator has automatic optimization. The STB is a unique indicator that shows the tendency (button Bars) of a particular signals. The STB tells us
BoxChart MT4
Evgeny Shevtsov
4.5 (6)
The market is unfair if only because 10% of participants manage 90% of funds. An ordinary trader has slim changes to stand against these "vultures". This problem can be solved. You just need to be among these 10%, learn to predict their intentions and move with them. Volume is the only preemptive factor that faultlessly works on any timeframe and symbol. First, the volume appears and is accumulated, and only then the price moves. The price moves from one volume to another. Areas of volume accumu
L'indicatore costruisce le quotazioni attuali, che possono essere confrontate con quelle storiche e su questa base fanno una previsione del movimento dei prezzi. L'indicatore ha un campo di testo per una rapida navigazione fino alla data desiderata. Opzioni: Simbolo - selezione del simbolo che visualizzerà l'indicatore; SymbolPeriod - selezione del periodo da cui l'indicatore prenderà i dati; IndicatorColor - colore dell'indicatore; HorisontalShift - spostamento delle virgolette d
Blahtech Supply Demand
Blahtech Limited
4.61 (33)
Was: $299  Now: $99   Supply Demand uses previous price action to identify potential imbalances between buyers and sellers. The key is to identify the better odds zones, not just the untouched ones. Blahtech Supply Demand indicator delivers functionality previously unavailable on any trading platform. This 4-in-1 indicator not only highlights the higher probability zones using a multi-criteria strength engine, but also combines it with multi-timeframe trend analysis, previously confirmed swings
L'unicità di questo indicatore risiede nell'algoritmo di contabilità del volume: l'accumulo avviene direttamente per il periodo selezionato senza riferimento all'inizio della giornata. Le ultime barre possono essere escluse dal calcolo, quindi i dati attuali avranno meno influenza sui livelli significativi (volumi) formati in precedenza. Per un calcolo più accurato, per impostazione predefinita vengono utilizzati i dati del grafico M1. La fase di distribuzione dei volumi di prezzo è regolamentat
Time Bubble ***Specialized for GBPJPY 1H time frame*** (tested for two years with success rates about 82%) Time Circle's smart algorithm detects the price circles with time . give strong signals at the right time as result of combine the price and time. our team spent months to develop this indicator specially for GBPJPY ..with high success rates about 82% win trades over two years .tested from December 2016 to November 2018. *** in last two years total signals 1012 with 829 Wins and
VR Grid
Vladimir Pastushak
5 (2)
L'indicatore Griglia VR è progettato per creare una griglia grafica con impostazioni definite dall'utente. A differenza della griglia standard , VR Grid viene utilizzata per costruire livelli circolari . A seconda della scelta dell'utente, il passaggio tra i livelli rotondi può essere arbitrario. Inoltre, a differenza di altri indicatori e utilità, VR Grid mantiene la posizione della griglia anche quando cambia l'intervallo di tempo o si riavvia il terminale. È possibile ottenere impostazioni, f
FREE
The Market Profile Indicator for MT4 displays the price levels and zones where increased trading activity happens. These zones with substantial forex trading activity provide the forex traders with the best entry levels, support, and resistance levels. Moreover, price levels indicate the best reversal zones. As a result, forex traders can identify BULLISH and BEARISH market trends and BUY and SELL entry points as well as the best reversal points. The indicator works well in all intraday timefram
Indicatore Volume Profile per MT4 Ottieni un vantaggio nel trading con l'indicatore "Volume Profile" per MetaTrader 4 (MT4). Questo strumento avanzato di analisi tecnica ti permette di identificare con precisione i livelli chiave di supporto e resistenza basati sul volume delle transazioni. Visualizza facilmente le aree di maggiore interesse del mercato, dove i volumi di scambio sono più alti, e sfrutta queste informazioni per prendere decisioni di trading più informate. Caratteristiche principa
Un indicatore tecnico che calcola le sue letture sui volumi di scambio. Sotto forma di istogramma, mostra l'accumulo della forza del movimento dello strumento di trading. Dispone di sistemi di calcolo indipendenti per le direzioni rialziste e ribassiste. Funziona su qualsiasi strumento di trading e intervallo di tempo. Può integrare qualsiasi sistema di trading. L'indicatore non ridisegna i suoi valori, i segnali appaiono sulla candela corrente. È facile da usare e non carica il grafico, non r
The indicator allows you to trade binary options. The recommended time frame is М1 and the expiration time is 1,2,3 minutes. The indicator suitable for auto and manual trading. A possible signal is specified as a arrows above/under a candle. You should wait until the candle closes! Arrows are not re-painted Trade sessions: TOKYO section (Half-end) Currency pairs: USD/JPY Working time frame: M1 Expiration time: 1,2,3 minutes. The indicator also shows good results when using the martingale strateg
FREE
RiverScope Lite automatically determines the nearest most important price levels and support and resistance zones in history, it also identifies a large number of price action patterns (the lite version is limited to 10, while the full version has 30+). The support and resistance levels are determined based on an algorithm that calculates and filters the historical values of the price, its movement character, volumes, etc. It displays the current situation, therefore the nearest levels change in
The Chaikin Oscillator is a technical indicator developed by Marc Chaikin that combines price and volume data to measure the accumulation and distribution of a financial instrument. It aims to identify potential buying and selling opportunities in the market. The Chaikin Oscillator is calculated by subtracting a 10-day exponential moving average of the Accumulation Distribution Line (ADL) from a 3-day exponential moving average of the ADL. Here's how to use the Chaikin Oscillator indicator in tr
SmartSignal Sniper
Ahmed Ismail Muhammad Ismail Al Talhat
SmartSignal Sniper: Il Tuo Compagno di Trading Definitivo Scopri il potere del trading preciso con SmartSignal Sniper. Progettato per fornire segnali di acquisto e vendita precisi, questo strumento avanzato consente ai trader di tutti i livelli di navigare nei mercati finanziari con fiducia e chiarezza. Principali Caratteristiche: Precisione Millimetrica: SmartSignal Sniper utilizza algoritmi avanzati per fornire segnali di acquisto e vendita precisi, aiutando i trader a individuare opportunità
Master Scalping M1 è un indicatore innovativo che utilizza un algoritmo per determinare il trend in modo rapido e preciso. L'indicatore calcola il tempo di apertura e chiusura delle posizioni, gli algoritmi dell'indicatore consentono di trovare i momenti ideali per entrare in un trade (acquistare o vendere un asset), il che aumenta il successo delle transazioni per la maggior parte dei trader. Vantaggi dell'indicatore: Facile da usare, non sovraccarica il grafico con informazioni inutili. Può es
Scalping Snake Pro is a unique scalping indicator that shows the trader the price reversal moments and does not redraw. This indicator, unlike many others on the Internet, does not redraw its values. It draws signals on the very first bar, which allows you not to be late with opening deals. This indicator sends notifications to the trader by phone and email when a signal appears. You get all this functionality for only $147. How to trade with this indicator? Open the H1 timeframe. Currency pa
VolumeProfile
Robert Hess
3.8 (5)
Descption: The Volume Profile displays detailed informations of historical trading activities at certain price levels (Market Profile). So you can locate the areas with the best prices in the market and get an advantage about other market participants. Features: Customizable Volume Profile / Market Profile Shows the "fair" Value Area with 70% of all Volume Shows critical low volume zones Shows VPOC, VAL and VAH Points Works on all timeframes Also available for MT5 ( https://www.mql5.com/en/m
We present you the indicator "Candle closing counter", which will become your indispensable assistant in the world of trading. That’s why knowing when the candle will close can help: If you like to trade using candle patterns, you will know when the candle will be closed. This indicator will allow you to check if a known pattern has formed and if there is a possibility of trading. The indicator will help you to prepare for market opening and market closure. You can set a timer to create a p
GND Tail Candle
Nguyen Dang Giang
A tall upper shadow occurs when the price moves during the period, but goes back down, which is a bearish signal. A tall lower shadow forms when bears push the price down, but bulls pull it back up, which leaves a long line or shadow. This is considered a bullish signal. Some technical analysts believe a tall or long shadow means the stock will turn or reverse. Some believe a short or lower shadow means a price rise is coming. In other words, a tall upper shadow means a downturn is coming, whil
First and foremost, the Insight Flow Indicator stands out as a Non-Repainting, Non-Redrawing, and Non-Lagging tool. This makes it a prime choice for both manual and algorithmic trading, ensuring reliable and consistent signals. User Manual: Settings, Inputs, and Strategy The Insight Flow Indicator leverages price action, strength, and momentum to provide a clear edge in the market. Equipped with advanced filters, it eliminates noise and false signals, enhancing trading potential. By using multip
Displays the local time with the time difference you set. (It does not correspond to the time difference in 30-minute increments.) It also displays a price line with a good price, such as 100.000 .100 or .200. The standard gridlines are displayed with the time and price by MT4, but they are very confusing as they become the broker's time and are displayed at the halfway point along with the price. It hides them and displays gridlines at user-defined time differences and prices in easy-to-und
Indicator for binary options arrow is easy to use and does not require configuration works on all currency pairs, cryptocurrencies buy signal blue up arrow sell signal red down arrow tips do not trade during news and 15-30 minutes before their release, as the market is too volatile and there is a lot of noise it is worth entering trades one or two candles from the current period (recommended for 1 candle) timeframe up to m 15 recommended money management fixed lot or fixed percentage of the depo
TWO PAIRS SQUARE HEDGE METER INDICATOR Try this brilliant 2 pairs square indicator It draws a square wave of the relation between your two inputs symbols when square wave indicates -1 then it is very great opportunity to SELL pair1 and BUY Pair2 when square wave indicates +1 then it is very great opportunity to BUY pair1 and SELL Pair2 the inputs are : 2 pairs of symbols         then index value : i use 20 for M30 charts ( you can try other values : 40/50 for M15 , : 30 for M30 , : 10 for H1 ,
Noize Absorption Index MT4
Ekaterina Saltykova
5 (1)
Noize Absorption Index - is the manual trading system that measures the difference of pressure between bears forces and bulls forces. Green line - is a noize free index that showing curent situation. Zero value of index shows totally choppy/flat market.Values above zero level shows how powerfull bullish wave is and values below zero measures bearish forces.Up arrow appears on bearish market when it's ready to reverse, dn arrow appears on weak bullish market, as a result of reverse expectation. S
TS krachobor
Magomed Zakaryaev
Всем привет! Выставляю свою торговую стратегию для форекс (далее - ТС). После покупки или аренды ТС пишете мне, я вас добавляют в закрытый чат телеграм, где дам все индикаторы и поддержку по торговле, и мы вместе будем торговать. Статистику по торговле в ТС я добавлю чуть позже, так как открыл новый счет по ТС, что бы было наглядно как проходит торговля. Кроме этого  я дам счет и пароль инвестора, можете сами смотреть в живую торговлю и решить для себя подходит ли она для вас. Два режима, 1) Сре
Fibonacci retracement and extension line drawing tool Fibonacci retracement and extended line drawing tool for MT4 platform is suitable for traders who use  golden section trading Advantages: There is no extra line, no too long line, and it is easy to observe and find trading opportunities Trial version: https://www.mql5.com/zh/market/product/35884 Main functions: 1. Multiple groups of Fibonacci turns can be drawn directly, and the relationship between important turning points
A "Volume Profile" is an advanced charting indicator that displays total volume traded at every price level over a user specified time period. The main components of the volume profile are POC ( Point Of Control - the price level, at which the maximum number of contracts were executed during a selected period), VAH ( Value Area High - the highest price in the Value Area) and VAL ( Value Area Low - the lowest price in the Value Area). When we settled on the original indicator, we spent a lot o
Super Reversal Pattern
Parfait Mujinga Ndalika
Super Reversal Pattern Indicator Unlock the power of advanced pattern recognition with our Super Reversal Pattern Indicator. Designed for traders seeking precision and reliability, this indicator identifies one of the most effective reversal patterns in technical analysis, offering a significant edge in your trading strategy. Key Features: Non-Repainting Accuracy: Enjoy the confidence of non-repainting technology. Once a Super Reversal Pattern is detected, it remains static, providing consis
Gli utenti di questo prodotto hanno anche acquistato
Gann Made Easy
Oleg Rodin
4.86 (83)
Gann Made Easy è un sistema di trading Forex professionale e facile da usare che si basa sui migliori principi del trading utilizzando la teoria di mr. WD Gann. L'indicatore fornisce segnali ACQUISTA e VENDI accurati, inclusi i livelli di Stop Loss e Take Profit. Puoi fare trading anche in movimento utilizzando le notifiche PUSH. Vi prego di contattarmi dopo l'acquisto! Condividerò i miei consigli di trading con te e fantastici indicatori bonus gratuitamente! Probabilmente hai già sentito parlar
- Real price is 80$ - 40% Discount ( It is 49$ now ) Contact me for instruction, add group and any questions! Related Products:  Bitcoin Expert , Gold Expert Introduction The breakout and retest strategy is traded support and resistance levels. it involves price breaking through a previous level.  The break and retest strategy is designed to help traders do two main things, the first is to avoid false breakouts. Many false breakouts start with a candlestick that breaks out of a level but ends w
FX Volume
Daniel Stein
4.58 (33)
Ricevi il tuo aggiornamento quotidiano sul mercato con dettagli e schermate tramite il nostro Morning Briefing qui su mql5 e su Telegram ! FX Volume è il PRIMO e UNICO indicatore di volume che fornisce una visione REALE del sentiment del mercato dal punto di vista del broker. Fornisce informazioni straordinarie su come gli operatori di mercato istituzionali, come i broker, sono posizionati sul mercato Forex, molto più velocemente dei rapporti COT. Vedere queste informazioni direttamente sul vo
Enigmera
Ivan Stefanov
5 (3)
ENIGMERA: Il cuore del mercato https://www.enigmera.com Introduzione Questo indicatore e sistema di trading rappresenta un approccio straordinario ai mercati finanziari. ENIGMERA utilizza i cicli frattali per calcolare con precisione i livelli di supporto e resistenza. Mostra l'autentica fase di accumulazione e fornisce direzione e obiettivi.  Un sistema che funziona sia in un trend che in una correzione.  Come funziona? ENIGMERA è composto da tre linee: la linea di supporto/resistenza, la
Gold Stuff
Vasiliy Strukov
4.89 (241)
Gold Stuff è un indicatore di tendenza progettato specificamente per l'oro e può essere utilizzato anche su qualsiasi strumento finanziario. L'indicatore non ridisegna e non è in ritardo. Periodo consigliato H1. Su di esso l'indicatore funziona in modo completamente automatico Expert Advisor EA Gold Stuff. Lo trovi nel mio profilo. I risultati in tempo reale possono essere visualizzati qui.  Puoi ottenere una copia gratuita del nostro indicatore Strong Support e Trend Scanner, per favore scri
Atomic Analyst
Issam Kassas
5 (2)
Innanzitutto, vale la pena sottolineare che questo indicatore di trading non è repaint, non è ridisegno e non presenta ritardi, il che lo rende ideale sia per il trading manuale che per quello automatico. Manuale utente: impostazioni, input e strategia. L'Analista Atomico è un indicatore di azione del prezzo PA che utilizza la forza e il momentum del prezzo per trovare un miglior vantaggio sul mercato. Dotato di filtri avanzati che aiutano a rimuovere rumori e segnali falsi, e aumentare il pote
FX Power MT4 NG
Daniel Stein
5 (13)
Ricevi il tuo aggiornamento quotidiano sul mercato con dettagli e schermate tramite il nostro Morning Briefing qui su mql5 e su Telegram ! FX Power MT4 NG è la nuova generazione del nostro popolare misuratore di forza delle valute, FX Power. Cosa offre questo misuratore di forza di nuova generazione? Tutto ciò che avete amato dell'FX Power originale IN PIÙ Analisi della forza di ORO/XAU Risultati di calcolo ancora più precisi Periodi di analisi configurabili individualmente Limite di calcolo pe
Trend Punch
Mohamed Hassan
4.95 (19)
This indicator is unstoppable when combined with our other indicator called  Support & Resistance . After purchase, send us a message and you will get it   for  FREE as a BONUS! Introducing Trend Punch , the revolutionary forex trend indicator that will transform the way you trade! Trend Punch is uniquely designed to provide precise buy and sell arrows during strong market trends, making your trading decisions clearer and more confident. Whether you're trading major currency pairs or exotic sym
Gann Swing Structure
Kirill Borovskii
5 (1)
This indicator is based on the mathematics of the great trader W.D. Ganna. With its help, you can easily find strong levels by analyzing swings to find the optimal entry point. The indicator works on all instruments and all timeframes. The indicator is fully manual and has control buttons. All you need to do is press the NEW button, a segment will appear, which you can place on any movement, swing or even 1 candle that you want to analyze. By placing the segment, press the OK button. A grid (th
Scalper Inside PRO
Alexey Minkov
4.73 (56)
An exclusive indicator that utilizes an innovative algorithm to swiftly and accurately determine the market trend. The indicator automatically calculates opening, closing, and profit levels, providing detailed trading statistics. With these features, you can choose the most appropriate trading instrument for the current market conditions. Additionally, you can easily integrate your own arrow indicators into Scalper Inside Pro to quickly evaluate their statistics and profitability. Scalper Inside
Dynamic Forex28 Navigator
Bernhard Schweigert
5 (1)
Dynamic Forex28 Navigator - Lo strumento di trading Forex di nuova generazione. ATTUALMENTE SCONTATO DEL 49%. Dynamic Forex28 Navigator è l'evoluzione dei nostri indicatori popolari di lunga data, che combinano la potenza di tre in uno: Advanced Currency Strength28 Indicator (695 recensioni) + Advanced Currency IMPULSE con ALERT (520 recensioni) + CS28 Combo Signals (Bonus). Dettagli sull'indicatore https://www.mql5.com/en/blogs/post/758844 Cosa offre l'indicatore di forza di nuova generazion
Attualmente 20% di sconto! La soluzione migliore per ogni principiante o trader esperto! Questo software per cruscotti funziona su 28 coppie di valute. Si basa su 2 dei nostri indicatori principali (Advanced Currency Strength 28 e Advanced Currency Impulse). Offre un'ottima panoramica dell'intero mercato Forex. Mostra i valori di forza delle valute avanzate, la velocità di movimento delle valute e i segnali per 28 coppie Forex in tutti i (9) timeframe. Immaginate come migliorerà il vostro t
Trend Screener
STE S.S.COMPANY
4.81 (88)
Indicatore di tendenza, soluzione unica rivoluzionaria per il trading di tendenze e il filtraggio con tutte le importanti funzionalità di tendenza integrate in un unico strumento! È un indicatore multi-timeframe e multi-valuta al 100% non ridipingibile che può essere utilizzato su tutti i simboli/strumenti: forex, materie prime, criptovalute, indici e azioni. OFFERTA A TEMPO LIMITATO: l'indicatore di screening di supporto e resistenza è disponibile a soli 50$ e a vita. (Prezzo originale 250$) (o
TPSproTREND PrO
Roman Podpora
4.79 (19)
TPSpro TREND PRO   è un indicatore di tendenza che analizza automaticamente il mercato, fornisce informazioni sulla tendenza e sui rispettivi cambiamenti e fornisce segnali per entrare nelle operazioni senza ridisegnare. L'indicatore utilizza ciascuna candela e la analizza separatamente. Si riferisce a vari shock al rialzo o al ribasso. Punto di ingresso preciso per il trading di valute, criptovalute, metalli, azioni e indici! Versione MT5                   Descrizione completa dell'indicatore
Vi presentiamo ON Trade Waves Patterns Harmonic Elliot Wolfe, un indicatore avanzato progettato per rilevare vari tipi di pattern sul mercato utilizzando metodi sia manuali che automatici. Ecco come funziona: Pattern Armonici: Questo indicatore è in grado di individuare pattern armonici che appaiono sul vostro grafico. Questi pattern sono fondamentali per i trader che praticano la teoria del trading armonico, come descritta nel libro di Scott Carney "Harmonic Trading vol 1 & 2". Che li disegniat
Scalper Vault
Oleg Rodin
5 (27)
Scalper Vault è un sistema di scalping professionale che ti fornisce tutto il necessario per scalping di successo. Questo indicatore è un sistema di trading completo che può essere utilizzato dai trader di forex e opzioni binarie. L'intervallo di tempo consigliato è M5. Il sistema fornisce segnali di freccia accurati nella direzione della tendenza. Ti fornisce anche i segnali più alti e più bassi e i livelli di mercato di Gann. Gli indicatori forniscono tutti i tipi di avvisi, comprese le notifi
TPA True Price Action indicator reveals the true price action of the market makers through 100% non-repainting signals (except early signals mode) strictly at the close of a candle! TPA shows entries and re-entries, every time the bulls are definitely stronger than the bears and vice versa. Not to confuse with red/green candles. The shift of power gets confirmed at the earliest stage and is ONE exit strategy of several. There are available now two free parts of the TPA User Guide for our custo
Stratos Pali
Michela Russo
5 (1)
Stratos Pali Indicator   is a revolutionary tool designed to enhance your trading strategy by accurately identifying market trends. This sophisticated indicator uses a unique algorithm to generate a complete histogram, which records when the trend is Long or Short. When a trend reversal occurs, an arrow appears, indicating the new direction of the trend. Important Information Revealed Leave a review and contact me via mql5 message to receive My Top 5 set files for Stratos Pali at no cost! D
Currency Strength Wizard è un indicatore molto potente che ti fornisce una soluzione all-in-one per un trading di successo. L'indicatore calcola la potenza di questa o quella coppia forex utilizzando i dati di tutte le valute su più intervalli di tempo. Questi dati sono rappresentati in una forma di indice di valuta facile da usare e linee elettriche di valuta che puoi utilizzare per vedere il potere di questa o quella valuta. Tutto ciò di cui hai bisogno è collegare l'indicatore al grafico che
PRO Renko System
Oleg Rodin
5 (25)
PRO Renko System è un sistema di trading altamente accurato appositamente progettato per il trading di grafici RENKO. Questo è un sistema universale che può essere applicato a vari strumenti di trading. Il sistema neutralizza efficacemente il cosiddetto rumore di mercato che consente di accedere a segnali di inversione accurati. L'indicatore è molto facile da usare e ha un solo parametro responsabile della generazione del segnale. Puoi facilmente adattare lo strumento a qualsiasi strumento
TPSpro RFI Levels
Roman Podpora
4.82 (22)
ISTRUZIONI       RUS   -   INGLESE       Si   consiglia di utilizzare con un indicatore       -       TPSpro   TENDENZA PRO -   Versione MT4         Un elemento chiave nel trading sono le zone o i livelli da cui vengono prese le decisioni di acquisto o vendita di uno strumento di trading. Nonostante i tentativi dei principali attori di nascondere la loro presenza sul mercato, lasciano inevitabilmente delle tracce. Il nostro compito era imparare a identificare queste tracce e interpretarle corre
Currency Strength Exotics
Bernhard Schweigert
4.87 (30)
ATTUALMENTE SCONTATO DEL 20%! La soluzione migliore per qualsiasi principiante o trader esperto! Questo indicatore è specializzato nel mostrare la forza della valuta per qualsiasi simbolo come coppie esotiche, materie prime, indici o futures. È il primo nel suo genere, qualsiasi simbolo può essere aggiunto alla nona riga per mostrare la vera forza della valuta di Oro, Argento, Petrolio, DAX, US30, MXN, TRY, CNH ecc. Si tratta di uno strumento di trading unico, di alta qualità e conveniente
Trend Pulse
Mohamed Hassan
5 (4)
Please contact me after purchase to immediately get your PDF strategy + documentation for Trend Pulse !  Introducing Trend Pulse , a unique and robust indicator capable of detecting bullish, bearish, and even ranging trends! Trend Pulse uses a special algorithm to filter out market noise with real precision. If the current symbol is moving sideways, Trend Pulse will send you a ranging signal, letting you know that it's not a good time to enter a trade. This excellent system makes Trend Pulse
Innanzitutto, vale la pena sottolineare che questo Strumento di Trading è un Indicatore Non-Ridipingente, Non-Ridisegnante e Non-Laggante, il che lo rende ideale per il trading professionale. Corso online, manuale utente e demo. L'Indicatore Smart Price Action Concepts è uno strumento molto potente sia per i nuovi che per i trader esperti. Racchiude più di 20 utili indicatori in uno solo, combinando idee di trading avanzate come l'Analisi del Trader del Circolo Interno e le Strategie di Trading
MetaBands M4
Vahidreza Heidar Gholami
5 (2)
MetaBands uses powerful and unique algorithms to draw channels and detect trends so that it can provide traders with potential points for entering and exiting trades. It’s a channel indicator plus a powerful trend indicator. It includes different types of channels which can be merged to create new channels simply by using the input parameters. MetaBands uses all types of alerts to notify users about market events. Features Supports most of the channel algorithms Powerful trend detection algorith
ICT, SMC, SMART MONEY CONCEPTS, SMART MONEY, Smart Money Concept, Support and Resistance, Trend Analysis, Price Action, Market Structure, Order Blocks, BOS/CHoCH,   Breaker Blocks ,  Momentum Shift,   Supply&Demand Zone/Order Blocks , Strong Imbalance, HH/LL/HL/LH,    Fair Value Gap, FVG,  Premium  &   Discount   Zones, Fibonacci Retracement, OTE, Buy Side Liquidity, Sell Side Liquidity, BSL/SSL Taken, Equal Highs & Lows, MTF Dashboard, Multiple Time Frame, BigBar, HTF OB, HTF Market Structure, 
Gold Channel is a volatility-based indicator, developed with a specific timing algorithm for the XAUUSD pair, which consists of finding possible corrections in the market. This indicator shows two outer lines, an inner line (retracement line) and an arrow sign, where the theory of the channel is to help identify overbought and oversold conditions in the market. The market price will generally fall between the boundaries of the channel. If prices touch or move outside the channel it is a tra
Market Reversal Alerts
LEE SAMSON
4.19 (113)
Il profitto dalla struttura del mercato cambia quando il prezzo si inverte e si ritira. L'indicatore di avviso di inversione della struttura del mercato identifica quando una tendenza o un movimento di prezzo si sta avvicinando all'esaurimento e pronto a invertire. Ti avvisa dei cambiamenti nella struttura del mercato che in genere si verificano quando stanno per verificarsi un'inversione o un forte pullback. L'indicatore identifica inizialmente i breakout e lo slancio del prezzo, ogni volta
Automated Trendlines
Georgios Kalomoiropoulos
5 (16)
Le linee di tendenza sono lo strumento più essenziale di analisi tecnica nel forex trading. Sfortunatamente, la maggior parte dei trader non li disegna correttamente. L'indicatore automatizzato delle linee di tendenza è uno strumento professionale per i trader seri che ti aiuta a visualizzare il movimento di tendenza dei mercati. Esistono due tipi di linee di tendenza, linee di tendenza rialziste e linee di tendenza ribassiste. Nella tendenza rialzista, la linea di tendenza Forex viene t
Reversal Sniper is designed to find the extreme reversals of the price. Indicator collects data of Cycle Sniper Indicator. NOTE: REVERSAL SNIPER Indicator is made for Cycle Sniper Users as an additional tool.  However, it can be used by the traders who look for finding out strong reversal levels. Indicator works on all timeframes and all instruments. Reversal  Sniper  Checks: Harmonic Patterns RSI Zig Zag and Harmonic Swings Cycle Sniper Indicator's Buy / Sell Signals The complex algo i
Altri dall’autore
VR Lollipop
Vladimir Pastushak
4.6 (10)
Сrescita redditizia è la strategia principale del robot di trading *VR Lollipop*. Esercitare il commercio nella direzione di tendenza, aggiungere posizioni nella direzione di tendenza, spostare le posizioni a nessuna perdita e il più rapidamente possibile per ridurre le perdite, su tali principi è stata costruita la strategia di trading del robot VR Lollipop. Il trend trading con dynamic trailing stop raccoglie in modo più efficiente possibile tutti i movimenti di tendenza. Il robot di trading i
VR Smart Grid
Vladimir Pastushak
4.31 (167)
VR Smart Grid è un advisor di trading intelligente in grado di chiudere parzialmente un gran numero di posizioni di mercato con piccoli profitti. La chiusura in piccole parti consente di ridurre rapidamente ed efficacemente le posizioni in perdita. Nell'algoritmo dell'advisor sono programmate diverse strategie di trading ben congegnate. La principale strategia di trading si basa sulla costruzione di una rete di posizioni e sulla chiusura delle posizioni in piccole parti con un determinato profit
VR Locker
Vladimir Pastushak
4 (4)
Forex Expert Advisor VR Locker è una strategia di trading automatica basata sul trading a griglia che utilizza blocchi positivi. Un blocco positivo è una situazione in un conto di trading in cui una posizione di vendita è sopra una posizione di acquisto ed entrambe le posizioni sono aperte con lo stesso lotto. Per una serie di file, istruzioni e un bel bonus scrivimi Il monitoraggio del lavoro dell'advisor può essere trovato nel profilo dell'autore L'Expert Advisor è stato sviluppato per la co
VR Smart Grid MT5
Vladimir Pastushak
4.32 (25)
VR Smart Grid è un advisor di trading intelligente in grado di chiudere parzialmente un gran numero di posizioni di mercato con piccoli profitti. La chiusura in piccole parti consente di ridurre rapidamente ed efficacemente le posizioni in perdita. Nell'algoritmo dell'advisor sono programmate diverse strategie di trading ben congegnate. La principale strategia di trading si basa sulla costruzione di una rete di posizioni e sulla chiusura delle posizioni in piccole parti con un determinato profit
VR Calculate Martingale MT5
Vladimir Pastushak
5 (1)
L'indicatore VR Calculate Martingale è un potente strumento per pre-calcolare qualsiasi strategia di trading senza rischi. Poiché l'indicatore utilizza ordini virtuali, il trader può calcolare in anticipo qualsiasi sviluppo degli eventi sul conto di trading. Non hai più bisogno di tabelle e calcolatori EXCEL, non hai più bisogno di conoscere le formule per fare la media di posizioni multidirezionali con diversi lotti di trading. VR Calculate Martingale ti aiuterà a calcolare tutto. È possibile o
VR Pivot
Vladimir Pastushak
VR Pivot is an indicator of key pivot points. Pivot points are a special type of support and resistance levels that are used to determine the strongest price zones. Professional traders use pivot levels to determine prices at which there is a high probability of a price reversal. The levels are calculated using special mathematical formulas, which include the closing, opening, high, and low prices of the previous time period. The most effective is the daily period. It is important to note that a
VR Black Box MT5
Vladimir Pastushak
1 (1)
Consulente Un consulenteVR Black Box – è una potente strategia di trading basata sul seguire rigorosamente i prezzi. L'algoritmo del programma analizza il movimento del prezzo nella situazione: quando il prezzo sale, il consulente negozia per comprare uno strumento finanziario; se la posizione viene chiusa da Stop Loss, il commercio viene invertito, e il consulente continua a commerciare per la vendita. Tutto il trading avviene automaticamente, senza l'intervento di un trader. Questo consulente
VR Sync Charts MT5
Vladimir Pastushak
5 (3)
VR Sync Charts is a tool for synchronizing layout between windows. INDICATOR DOES NOT WORK IN STRATEGY TESTER!!! How to get a trial version with a test period, instructions, training, read the blog https://www.mql5.com/ru/blogs/post/726504 . VR Sync Charts allow you to synchronize trend levels, horizontal levels and Fibonacci layout with all charts. With this you can synchronize all standard graphic objects in the MetaTrader terminal. All your trends, Gann lines and other objects are exactly cop
VR Donchian MT5
Vladimir Pastushak
4.87 (15)
L'indicatore VR Donchian è una versione migliorata del canale Donchian. I miglioramenti hanno interessato quasi tutte le funzioni del canale, ma l'algoritmo operativo principale e la costruzione del canale sono stati preservati. All'indicatore a sfera è stato aggiunto un cambiamento nel colore dei livelli a seconda della tendenza attuale: questo mostra chiaramente al trader un cambiamento di tendenza o un livello piatto. È stata aggiunta la possibilità di informare il trader del superamento di u
FREE
VR Locker MT5
Vladimir Pastushak
3.5 (4)
Forex Expert Advisor VR Locker è una strategia di trading automatica basata sul trading a griglia che utilizza blocchi positivi. Un blocco positivo è una situazione in un conto di trading in cui una posizione di vendita è sopra una posizione di acquisto ed entrambe le posizioni sono aperte con lo stesso lotto. Per una serie di file, istruzioni e un bel bonus scrivimi Il monitoraggio del lavoro dell'advisor può essere trovato nel profilo dell'autore L'Expert Advisor è stato sviluppato per la co
VR Template Switcher è una potente utility per la gestione dei modelli di grafici nel terminale MetaTrader. Non c'è più bisogno di fare molto per caricare, salvare e cancellare i modelli. L'utility VR Template Switcher permette di salvare il modello di grafico corrente con tutti gli indicatori, i livelli e le impostazioni, nonché di caricarne un altro con un solo clic. Hai modelli per diversi strumenti finanziari? VR Template Switcher imposta il periodo e lo strumento finanziario richiesto quand
VR Donchian
Vladimir Pastushak
4.85 (13)
L'indicatore VR Donchian è una versione migliorata del canale Donchian. I miglioramenti hanno interessato quasi tutte le funzioni del canale, ma l'algoritmo operativo principale e la costruzione del canale sono stati preservati. All'indicatore a sfera è stato aggiunto un cambiamento nel colore dei livelli a seconda della tendenza attuale: questo mostra chiaramente al trader un cambiamento di tendenza o un livello piatto. È stata aggiunta la possibilità di informare il trader del superamento di u
FREE
VR Color Levels MT5
Vladimir Pastushak
VR Color Levels è uno strumento utile per coloro che applicano l'analisi tecnica utilizzando elementi come linea di tendenza, rettangolo e testo. È possibile aggiungere testo direttamente al grafico e acquisire screenshot. È possibile ottenere impostazioni, file di set, versioni demo, istruzioni e risoluzione dei problemi da [blog] Puoi leggere o scrivere recensioni su [collegamento] Versione per [MetaTrader 4] Il lavoro con l'indicatore viene eseguito in un clic . Per fare ciò, fare clic su
FREE
VR Watch list and Linker MT5
Vladimir Pastushak
4.86 (7)
Elenco di controllo VR e Linker - applicazione di screening per il terminale Meta Trader . Rende più facile trovare gli strumenti finanziari più interessanti e tecnici. Questo screener viene utilizzato dai trader per fare trading su borse come Bybit, Borsa di Mosca, American Exchange, mercato dei cambi e delle criptovalute, mercato dei metalli e viene utilizzato per il trading in società di prop. La selezione degli strumenti finanziari viene effettuata manualmente. Lo screener collega i grafici
FREE
VR Ticks MT5
Vladimir Pastushak
4.33 (3)
VR Ticks   è un indicatore speciale per strategie basate sullo scalping. Grazie a questo indicatore il trader può vedere il grafico tick direttamente sul grafico principale dello strumento finanziario. Un grafico tick ti consente di inserire una posizione nel mercato o chiudere una posizione nel mercato nel modo più accurato possibile. VR Ticks traccia i dati dei tick sotto forma di linee che cambiano colore a seconda della direzione: ciò consente di comprendere e valutare visivamente la situazi
FREE
VR Grid Mt5
Vladimir Pastushak
3.43 (7)
L'indicatore Griglia VR è progettato per creare una griglia grafica con impostazioni definite dall'utente. A differenza della griglia standard , VR Grid viene utilizzata per costruire livelli circolari . A seconda della scelta dell'utente, il passaggio tra i livelli rotondi può essere arbitrario. Inoltre, a differenza di altri indicatori e utilità, VR Grid mantiene la posizione della griglia anche quando cambia l'intervallo di tempo o si riavvia il terminale. È possibile ottenere impostazioni, f
FREE
VR Assistant Charts MT5
Vladimir Pastushak
5 (3)
VR Assistant Charts — Questo è uno strumento utile per i trader che lavorano con oggetti grafici nella finestra del terminale di trading MetaTrader. Il programma ti consente di modificare il colore, lo stile, lo spessore e altre caratteristiche delle linee di tendenza, dei livelli di Fibonacci, dei ventagli di Gann e di altri elementi grafici nel terminale MetaTrader con un clic del mouse. È possibile ottenere impostazioni, file di set, versioni demo, istruzioni e risoluzione dei problemi da [bl
FREE
VR Calculate Martingale
Vladimir Pastushak
5 (5)
L'indicatore VR Calculate Martingale è un potente strumento per pre-calcolare qualsiasi strategia di trading senza rischi. Poiché l'indicatore utilizza ordini virtuali, il trader può calcolare in anticipo qualsiasi sviluppo degli eventi sul conto di trading. Non hai più bisogno di tabelle e calcolatori EXCEL, non hai più bisogno di conoscere le formule per fare la media di posizioni multidirezionali con diversi lotti di trading. VR Calculate Martingale ti aiuterà a calcolare tutto. È possibile o
VR Black Box
Vladimir Pastushak
3.67 (3)
Consulente Un consulenteVR Black Box – è una potente strategia di trading basata sul seguire rigorosamente i prezzi. L'algoritmo del programma analizza il movimento del prezzo nella situazione: quando il prezzo sale, il consulente negozia per comprare uno strumento finanziario; se la posizione viene chiusa da Stop Loss, il commercio viene invertito, e il consulente continua a commerciare per la vendita. Tutto il trading avviene automaticamente, senza l'intervento di un trader. Questo consulente
VR Color Levels MT4
Vladimir Pastushak
VR Color Levels è uno strumento utile per coloro che applicano l'analisi tecnica utilizzando elementi come linea di tendenza, rettangolo e testo. È possibile aggiungere testo direttamente al grafico e acquisire screenshot. È possibile ottenere impostazioni, file di set, versioni demo, istruzioni e risoluzione dei problemi da [blog] Puoi leggere o scrivere recensioni su [collegamento] Versione per [MetaTrader 5] Il lavoro con l'indicatore viene eseguito in un clic . Per fare ciò, fare clic su
FREE
VR Watch list and Linker
Vladimir Pastushak
4.67 (9)
Elenco di controllo VR e Linker - applicazione di screening per il terminale Meta Trader . Rende più facile trovare gli strumenti finanziari più interessanti e tecnici. Questo screener viene utilizzato dai trader per fare trading su borse come Bybit, Borsa di Mosca, American Exchange, mercato dei cambi e delle criptovalute, mercato dei metalli e viene utilizzato per il trading in società di prop. La selezione degli strumenti finanziari viene effettuata manualmente. Lo screener collega i grafici
FREE
VR Sync Charts
Vladimir Pastushak
5 (6)
VR Sync Charts is a tool for synchronizing layout between windows. INDICATOR DOES NOT WORK IN STRATEGY TESTER!!! How to get a trial version with a test period, instructions, training, read the blog https://www.mql5.com/ru/blogs/post/726504 . VR Sync Charts allow you to synchronize trend levels, horizontal levels and Fibonacci layout with all charts. With this you can synchronize all standard graphic objects in the MetaTrader terminal. All your trends, Gann lines and other objects are exactly cop
VR Grid
Vladimir Pastushak
5 (2)
L'indicatore Griglia VR è progettato per creare una griglia grafica con impostazioni definite dall'utente. A differenza della griglia standard , VR Grid viene utilizzata per costruire livelli circolari . A seconda della scelta dell'utente, il passaggio tra i livelli rotondi può essere arbitrario. Inoltre, a differenza di altri indicatori e utilità, VR Grid mantiene la posizione della griglia anche quando cambia l'intervallo di tempo o si riavvia il terminale. È possibile ottenere impostazioni, f
FREE
VR Assistant Charts
Vladimir Pastushak
VR Assistant Charts — Questo è uno strumento utile per i trader che lavorano con oggetti grafici nella finestra del terminale di trading MetaTrader. Il programma ti consente di modificare il colore, lo stile, lo spessore e altre caratteristiche delle linee di tendenza, dei livelli di Fibonacci, dei ventagli di Gann e di altri elementi grafici nel terminale MetaTrader con un clic del mouse. È possibile ottenere impostazioni, file di set, versioni demo, istruzioni e risoluzione dei problemi da [bl
FREE
The VR Object Delete All script solves the problem of garbage on the chart. it is often necessary to completely clear the chart of everything that is put on it, comments, lines, objects. The script completely deletes everything, even those objects that are not visible. When working, VR Object Delete All writes everything it does in the terminal log, as well as the names of objects to delete. Displays the number of deleted objects as a separate line. in case of any errors, it will display an erro
FREE
VR Close Orders MT5
Vladimir Pastushak
1 (1)
The VR Close orders script is designed to close positions in the terminal at a profit or loss mark set by the trader. The program is written as a script and can work together on the same chart with any other indicators and expert advisors. The program has a simple visual panel and is easy to configure with the mouse. With this program's help, the trader can automatically close positions and delete orders depending on the conditions set.  There is often a situation when you need to close position
FREE
VR Ticks
Vladimir Pastushak
VR Ticks è un indicatore speciale per strategie basate sullo scalping. Grazie a questo indicatore il trader può vedere il grafico tick direttamente sul grafico principale dello strumento finanziario. Un grafico tick ti consente di inserire una posizione nel mercato o chiudere una posizione nel mercato nel modo più accurato possibile. VR Ticks traccia i dati dei tick sotto forma di linee che cambiano colore a seconda della direzione: ciò consente di comprendere e valutare visivamente la situazion
FREE
VR Orders History MT5
Vladimir Pastushak
1 (1)
The VR Orders History script is designed to upload a trade report to a csv file. This format is intended for additional analysis of trading history in programs such as EXCEL, Openoffice, and Libreoffice. Thanks to the script, it is now much easier for a trader to analyze their trading history. The program facilitates the analysis of the trading history for the MetaTrader 5 terminal. The trader sees structured trading. The entire report is based on the following principle: Position > Order on the
FREE
VR Orders History
Vladimir Pastushak
5 (3)
The VR Orders History script is designed to upload a trade report to a csv file. This format is intended for additional analysis of trading history in programs such as EXCEL, Openoffice, and Libreoffice. Thanks to the script, it is now much easier for a trader to analyze their trading history. The program facilitates the analysis of the trading history for the MetaTrader 5 terminal. The trader sees structured trading. The entire report is based on the following principle: Position > Order on the
FREE
VR Close Orders
Vladimir Pastushak
3.5 (4)
The VR Close orders script is designed to close positions in the terminal at a profit or loss mark set by the trader. The program is written as a script and can work together on the same chart with any other indicators and expert advisors. The program has a simple visual panel and is easy to configure with the mouse. With this program's help, the trader can automatically close positions and delete orders depending on the conditions set.  There is often a situation when you need to close position
FREE
Filtro:
David T
288
David T 2023.11.11 23:55 
 

Very useful indicator but as most indicators it is not meant to be used as a stand alone but as a confirmation . This indicator helps confirm of the market is breakout out or trending sideways. Still testing it but so far pleased with my purchase.

Yuriskam
206
Yuriskam 2023.06.21 04:44 
 

Этот индикатор будет полезен всем!

GoodMorningg
529
GoodMorningg 2023.04.14 06:20 
 

L'utente non ha lasciato alcun commento sulla valutazione.

elite luis
3351
elite luis 2023.04.03 03:49 
 

Looks Good and Author is responsive supportive, 5 stars for now, Thank you :)

adonis4ex
6308
adonis4ex 2021.08.03 15:14 
 

L'utente non ha lasciato alcun commento sulla valutazione.

Vladimir Pastushak
94667
Risposta dello sviluppatore Vladimir Pastushak 2021.08.03 15:16
Thank you!
intan08
1386
intan08 2021.07.28 11:53 
 

Author wasn't knowledgeable about settings for M15 chart.

OLEG SVERDLOV
346
OLEG SVERDLOV 2020.07.21 19:01 
 

L'utente non ha lasciato alcun commento sulla valutazione.

Rafael Cadosch
708
Rafael Cadosch 2020.06.15 23:54 
 

A must tool

Vitali Kadel
2367
Vitali Kadel 2020.06.13 20:18 
 

L'utente non ha lasciato alcun commento sulla valutazione.

Palmix
134
Palmix 2018.11.24 22:59 
 

L'utente non ha lasciato alcun commento sulla valutazione.

adam7samuel
143
adam7samuel 2018.09.23 00:51 
 

L'utente non ha lasciato alcun commento sulla valutazione.

Qun Li
579
Qun Li 2018.08.30 03:21 
 

L'utente non ha lasciato alcun commento sulla valutazione.

Tim Eubanks
5762
Tim Eubanks 2018.03.21 03:28 
 

L'utente non ha lasciato alcun commento sulla valutazione.

Maksym Mudrakov
29866
Maksym Mudrakov 2016.08.31 06:01 
 

L'utente non ha lasciato alcun commento sulla valutazione.

Rodrigo da Silva Boa
7136
Rodrigo da Silva Boa 2015.11.26 05:00 
 

L'utente non ha lasciato alcun commento sulla valutazione.

Harikrishnabhai Patel
682
Harikrishnabhai Patel 2015.09.19 09:44 
 

L'utente non ha lasciato alcun commento sulla valutazione.

Pavel Pavlov
666
Pavel Pavlov 2014.12.05 12:42 
 

L'utente non ha lasciato alcun commento sulla valutazione.

Vladimir Pastushak
94667
Risposta dello sviluppatore Vladimir Pastushak 2021.02.01 09:08
Спасибо Вам!
Artem Salamatov
123
Artem Salamatov 2014.10.09 08:02 
 

L'utente non ha lasciato alcun commento sulla valutazione.

Rispondi alla recensione
Versione 23.15 2023.02.06
Correction of filling objects with color.
Versione 23.14 2023.01.30
Correction of the indicator
Versione 23.13 2023.01.28
Correction:
Correction of loading the indicator at the start of the terminal. Previously, the indicator might not load.
Versione 23.12 2023.01.24
Correction:
Displaying values ​​as lines;

Optimization:
Code optimization;
Versione 23.11 2023.01.23
Made:

The indicator code has been heavily optimized. The code has become lighter and faster;
Corrected mathematics, the indicator has become more accurate;
Changed settings, now you can choose which shapes to fill with color;
Improved and connected several types of trader notifications (Alert, Push, email);
Versione 21.80 2021.08.24
The indicator is optimized and compiled in the latest build of the terminal.
Versione 20.91 2020.09.16
Bug fixes and improvements
Versione 20.90 2020.09.15
Added the ability to exclude paranormal bars
Added alert buttons
Indicator code optimized
Versione 20.60 2020.06.14
Code optimization for new build terminal
Versione 20.57 2020.05.27
Code optimization
Error correction
Versione 20.31 2020.03.16
code optimization
Versione 20.30 2020.03.14
Changelog:
Levels as areas - you can use areas to set the offset from the originally calculated level as a percentage (Percentage for the area).
Added the ability to calculate the accuracy of entry on a financial instrument (Show the accuracy of the indicator).
Added the ability to change the size of text labels.
Added the ability to change the size and position of notification buttons.
Added the ability to select notification buttons.
Translations of settings into Russian and English.
dded PDF documentation.

Optimized:
Sending alerts - now alerts are sent once after clicking the button. to resend the notification, click the button with the notification type.
Calculation of levels optimized and accelerated.
Versione 18.80 2018.08.21
Optimization :
Fixed an issue with the indicator operation in the strategy tester.
Versione 18.60 2018.06.25
The indicator has been revised from scratch.
Unnecessary windows have been removed.
Indicator operation speed has been increased.
Versione 16.1 2016.01.22
Fixed spelling errors.
Versione 15.111 2015.11.24
Fixed display when changing objects by X and Y axes
Versione 15.110 2015.11.23
Indicator has been rewritten from scratched. Old bugs are fixed, design is improved, new functionality and color setup are added.
Versione 15.70 2015.06.29
Some minor improvements at users' request!
Versione 15.61 2015.06.04

Fixed:
Names of the buttons. Names of the buttons are well-arranged now.
High 10 Days, Low 10 Days,
ATR High Current, ATR Low Current,
His ATR High, His ATR Low

Objects are removed when removing the indicator.
Versione 15.6 2015.06.01
Added:
Displaying stats on history.
Forecast and result are now displayed for the last 10 days, while previously the readings were shown only for the current day.
Versione 15.5 2015.04.30
Fixed:
The indicator display in the new builds.
Operation of the button for enabling/disabling the indicator.

Added:
The ability to import the indicator functions to Expert Advisors and indicators (see the description).
Versione 15.3 2015.03.25
Fixed:
Deletion of objects during removal of the indicator.
Versione 15.2 2015.02.05
Added:
A button for minimizing the indicator.

Addition made based on users' request.
Versione 14.12 2014.12.16
Fixed displaying of information with respect to new terminal builds.