Winshots Pivot Levels
- Indicatori
- Pawel Michalowski
- Versione: 1.5
- Attivazioni: 5
What is a Pivot?
A pivot is a significant price level known in advance which traders view as important and may make trading decisions around that level. As a technical indicator, a pivot price is similar to a resistance or support level. If the pivot level is exceeded, the price is expected to continue in that direction. Or the price could reverse at or near that level.
What does a Pivot Tell You?
There are pivots and pivot points. These terms may mean different things to different people.
Pivot points are calculated levels. Floor traders originally used a pivot point to establish important price levels, and those are now used by many traders for intraday trading. After analyzing data from the instrument’s historical price, a pivot point is used as a guide for how the price may move. Other calculations provide support and resistance levels around the pivot point. Pivot points can be calculated based on various time frames, therefore providing information to day trading, swing traders, and investors. Winshots Pivot Levels indicator provides information for day trading.
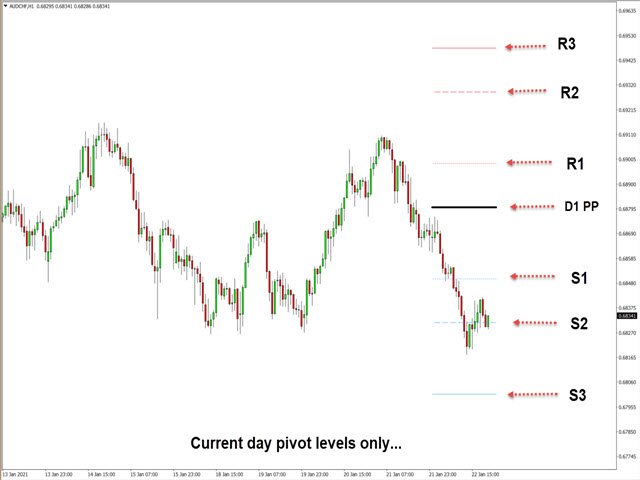
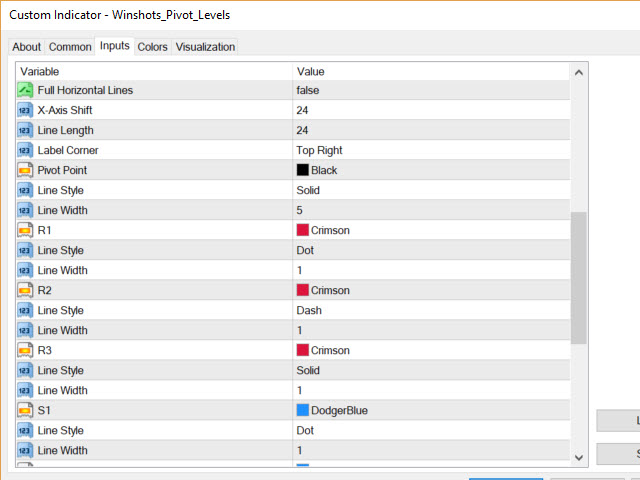
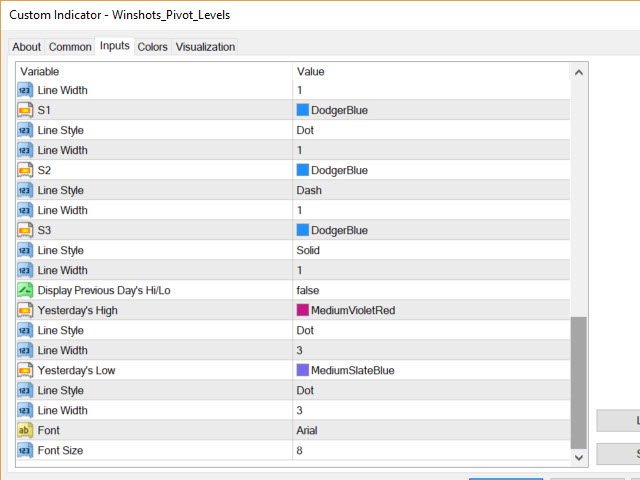
When the price is above a pivot point it is considered bullish, when the price is below the pivot point it is considered bearish. Levels above the pivot point are calculated and called R1, R2 and R3, with the R standing for Resistance. Levels below the pivot point are calculated and called S1, S2 and S3, with S standing for Support.
If the price moves below the pivot point it may continue to S1. If the price falls below S1, it may continue to S2. If the price falls below S2, it may continue to S3. The same concept applies to R1, R2 and R3.
How to Calculate a Pivot
The calculations for today's pivot levels are based on the prior day's high, low and closing prices. Winshots Pivot Levels indicator is based on those calculations.
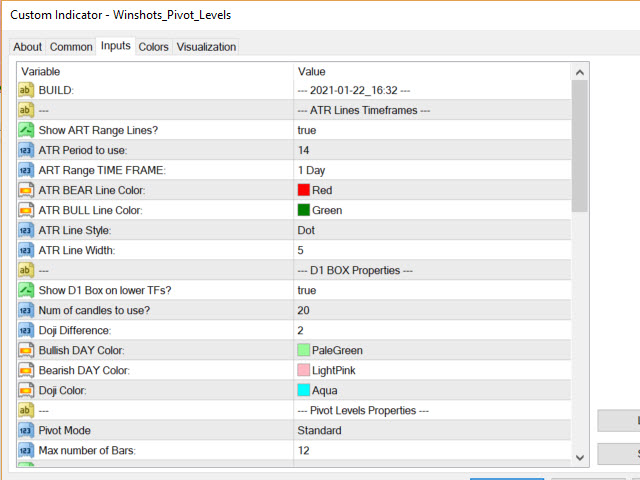
Winshots Pivot Levels indicator gives you an option to choose between the following types of pivots:
- Standard
- Fibonacci
- Camarilla
- Woodie
- Demark
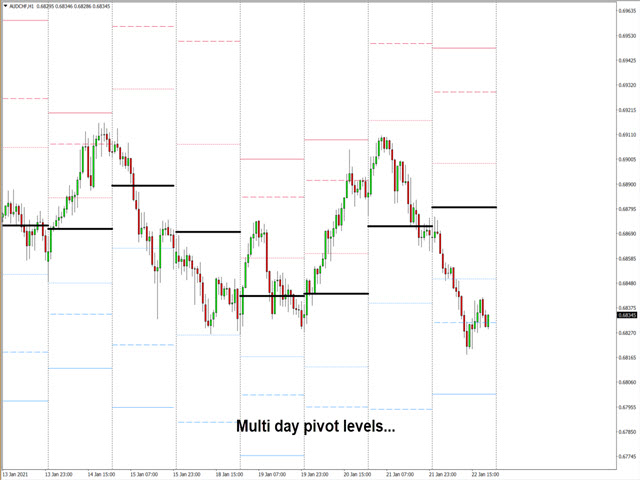
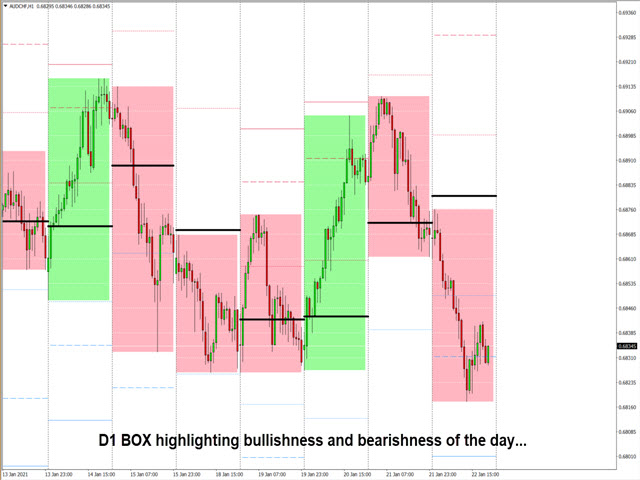
In addition to Pivot Levels Winshots Pivot Levels indicator can also draw custom D1 boxes around your lower time frame price action. This assists your pivot point strategy by clearly outlining the bullishness or bearishness of the daily candle while you’re trading on lower time frames. But that’s not all. Winshots Pivot Levels indicators will also how you those levels for past days, something that most indicators don’t do. You can use a “Max number of Bars” setting in the properties of the indicator to set exactly how many days/periods in the past you’d like to show pivot levels for. This can be tremendously helpful by allowing you to quickly visualize the direction of the prevailing trend based to pivots levels rising or falling.
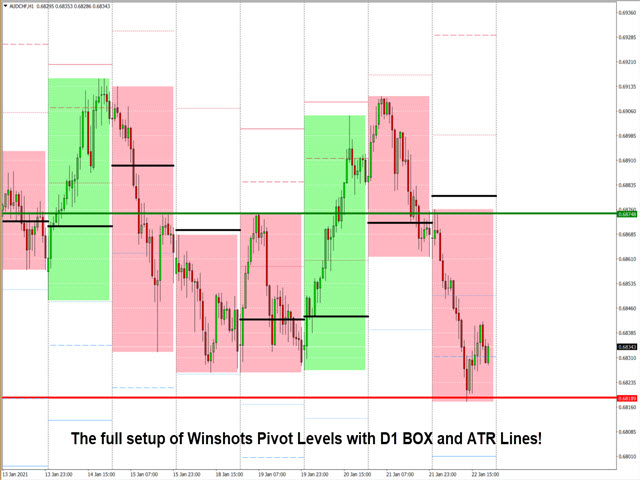
Pivots and pivot points are best used in conjunction with other forms of analysis. This is why Winshots Pivot Levels indicator packs additional two most important tools to help you become a more efficient trader: D1 (daily) box and D1 (daily) ATR (active/actual true range) zones. These two additions make trading any pivot strategy 3X better because you’re less likely to set your profits outside of the ATR zone or trade against the prevailing intraday trend of the daily (D1) candle, which is always highlighted by the D1 box.
Pivots and pivot points, while important, may get whipsawed leading to losing traders or confusion. For example, the price may move back and forth across the pivot point, moving a trader from bullish to bearish and back again. After moving through a pivot point the price may not proceed to the next expected level, such as R1 or S1. However with the addition of Winshots Pivot Levels indicator’s tools: D1 (daily) box and D1 (daily) ATR (active/actual true range) zones you can now make more sophisticated decisions in your pivot levels trading strategy.

