N Rally or Decline Reversal Finder
- Indicatori
- Thomas Christopher Johnson
- Versione: 1.0
- Attivazioni: 5
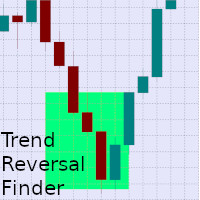
Listed in his faous book "Trading chart patterns like the pros", Suri Duddrella outlines the N-bar rally and decline reversal pattern, which simply states that when stocks make a new high or new low, momentum players will push this stock down or up until eventually they run out of steam.
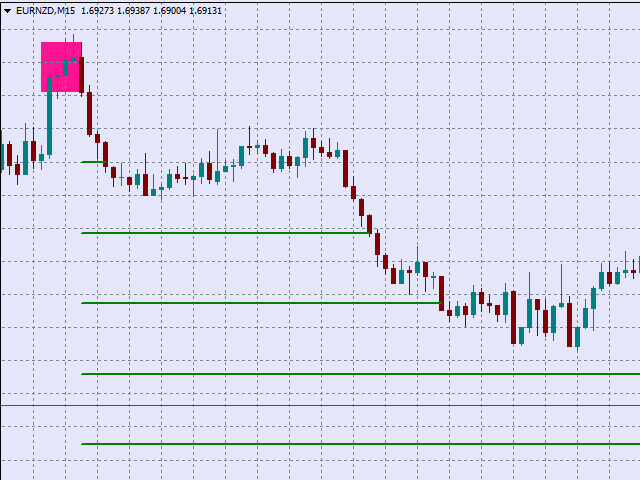
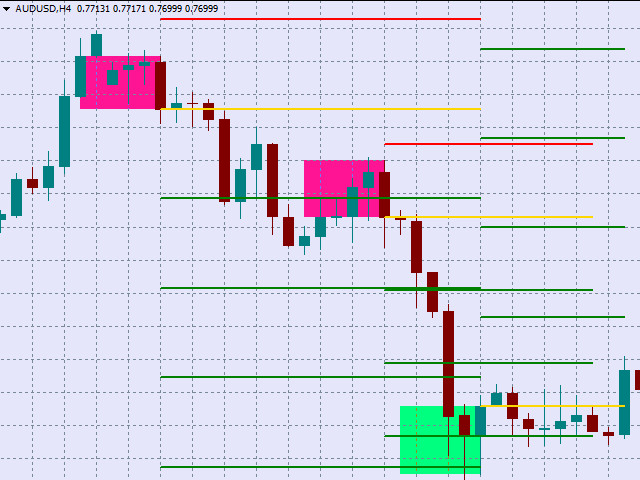
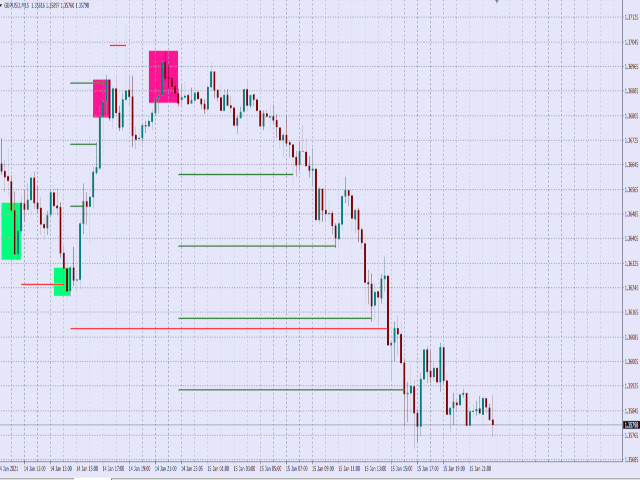
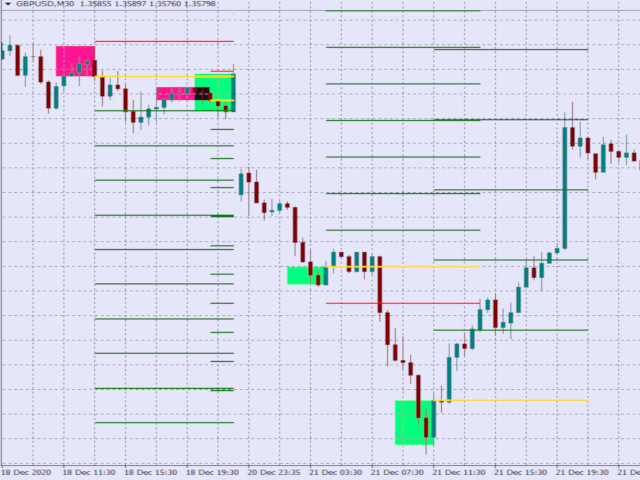
This indicator will look back a certain number of bars to find a continuous uninterrupted rally or decline. Once found, the pattern will look forwards to find the first bar that closes, within a certain range, above the open of the last lowest bar.
With this excellent indicator, it is possible to find the top and bottom by measuring price action and then getting an alert notifcation.
The show SL'sAndTps option will auto create a stop loss and take profit levels, using the lowest point of the decline pattern, or highest point of the rally pattern, and then add a percentage of either the average daily range or the pattern range itself.
The Analyse previous trades will run a quick forward analysis of each time the pattern is found, finding the points when take profits are hit and stop losses are hit. This powerful feature allows you to combine the pattern with your own preferred indicators to give you strong signals for entering trades.
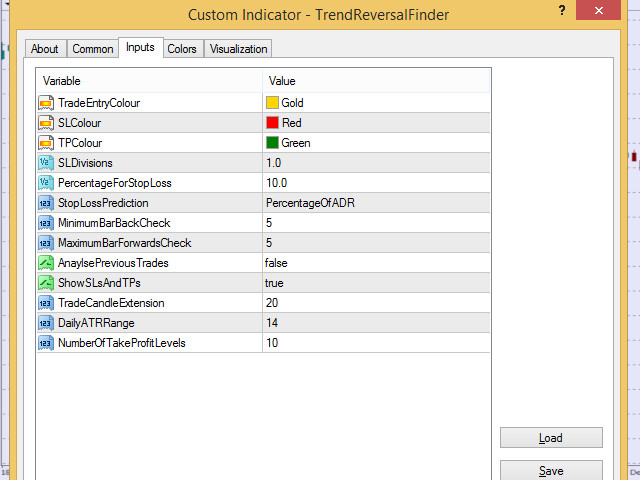
The MinimumBarBackCheck, default at 5, will look back that many bars to find an uninterrupted rally or decline, and the MaximumBarForwardsCheck will determine how many bars forwards to look after detecting a rally or decline to find a reversal.
The SL divisions will determine how much of the Stop Loss should create a take profit target. 1 to 1, 2.0 will be a take profit target of 2x the distance to the stop loss, or 0.5 would be half the distance to the stop loss as a profit target, allowing you to modify for your own particular style and risk tolerance.
