RSI Scanner With Two Levels
- Indicatori
- Richard Osei
- Versione: 3.0
- Aggiornato: 2 marzo 2021
- Attivazioni: 5
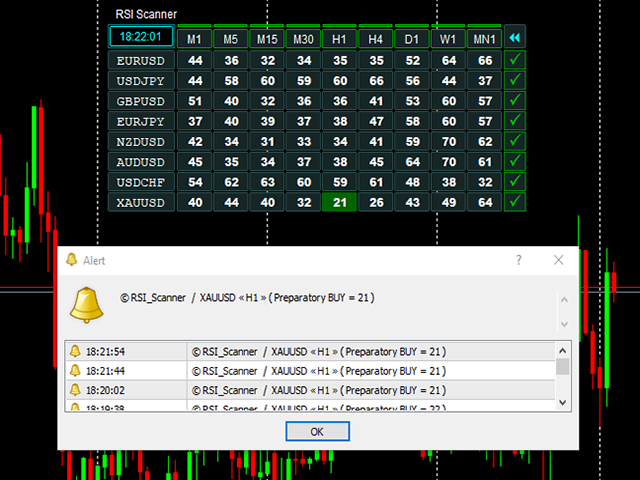
Scan all your favorite pairs with RSI, and get notified on your preferred time frames.
Settings are Customizable
Click to change time frame or open new pairs
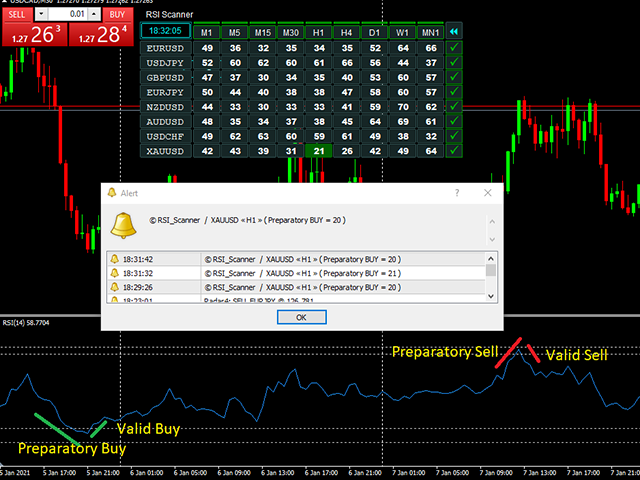
Notification: Phone/Popup/Email
The relative strength index (RSI) is a technical indicator used in the analysis of financial markets. It is intended to chart the current and historical strength or weakness of a pair/stock based on the closing prices of a recent trading period.
The RSI is most typically used on a 14 period, measured on a scale from 0 to 100, with high and low levels marked at 70 and 30, respectively. Short or longer timeframes are used for alternately shorter or longer outlooks. High and low levels—80 and 20, or 90 and 10—occur less frequently but indicate stronger momentum.
This scanner allow you to set two low levels and two high levels. The Scanner also notify traders when the set level is reached. Preparatory Buy/Sell and Valid Buy/Sell signals are sent
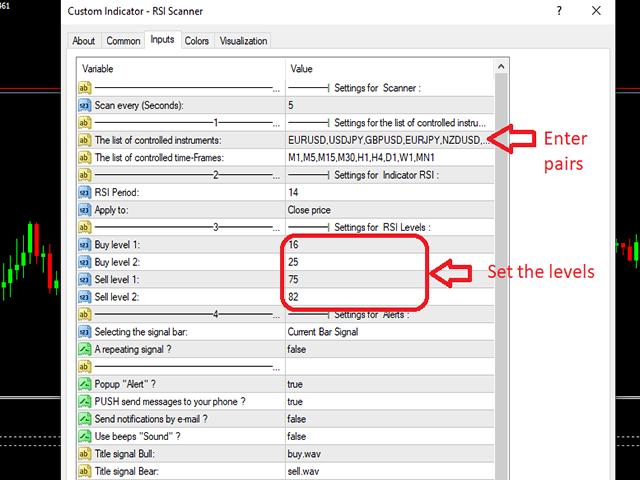
————————————————————————————————————————————————— = "————————| Settings for Scanner :";
Scanning = 5; // Scan every (Seconds):
————————————————————————1———————————————————————— = "————————| Settings for the list of controlled instruments and time-Frames :";
PairsToTrade = "EURUSD,USDJPY,GBPUSD,EURJPY,NZDUSD,AUDUSD,GBPJPY,USDCHF,XAUUSD"; // The list of controlled instruments:
TimeFrames = "M1,M5,M15,M30,H1,H4,D1,W1,MN1"; // The list of controlled time-Frames:
————————————————————————2———————————————————————— = "————————| Settings for Indicator RSI :";
RsiPeriod = 14; // RSI Period:
RsiPrices = PRICE_CLOSE; // Apply to:
————————————————————————3———————————————————————— = "————————| Settings for RSI Levels :";
buys_level_1 = 16; // Buy level 1:
buys_level_2 = 25; // Buy level 2:
sell_level_1 = 75; // Sell level 1:
sell_level_2 = 82; // Sell level 2:
————————————————————————4———————————————————————— = "————————| Settings for Alerts :";
NumSigBar = curr; // Selecting the signal bar:
Repeating = false; // A repeating signal ?
—————————————————————————————————————————— = "";
ShowAlert = true; // Popup "Alert" ?
SendPush = true; // PUSH send messages to your phone ?
SendMailInfo = false; // Send notifications by e-mail ?
ShowSound = false; // Use beeps "Sound" ?
SoundNameBull = "buy.wav"; // Title signal Bull:
L'utente non ha lasciato alcun commento sulla valutazione.