• Panoramica
  • Recensioni
  • Commenti

Atr Projection

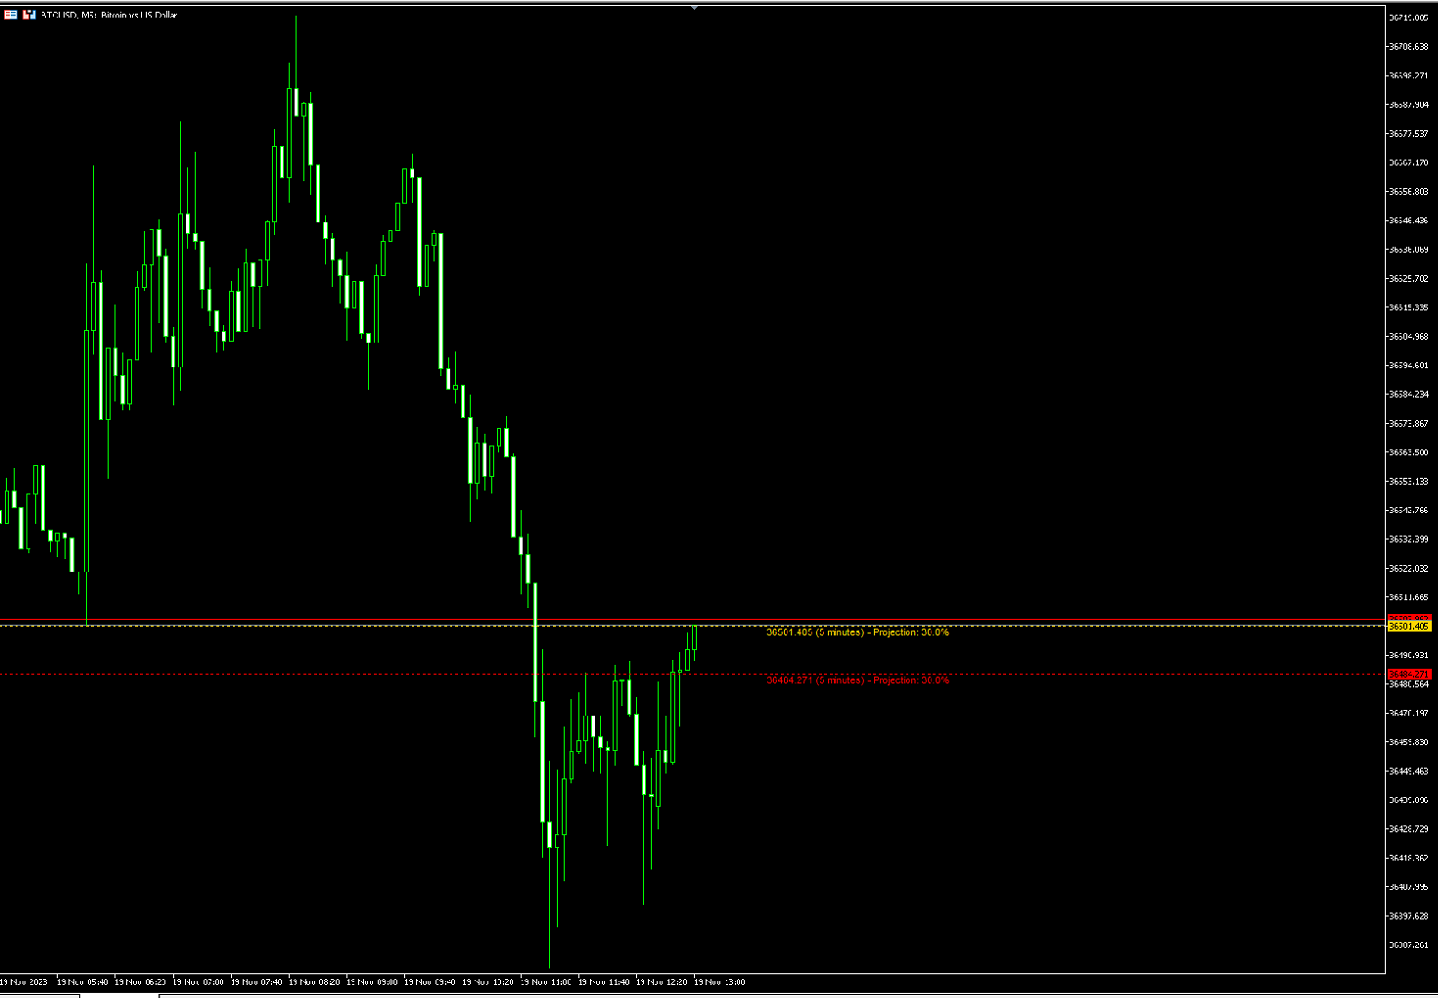
L'indicateur ATR Projeção se distingue comme un outil robuste dans l'analyse technique, conçu pour fournir des informations précises sur les limites potentielles des mouvements de prix sur les marchés financiers. Son approche flexible permet aux utilisateurs de personnaliser de manière intuitive les métriques d'analyse, en s'adaptant aux besoins spécifiques de chaque actif négocié.

Fonctionnement personnalisable :

Par défaut, l'ATR Projeção fonctionne en considérant 30 % de la moyenne des 100 dernières bougies. Cette flexibilité permet aux utilisateurs d'ajuster les métriques en fonction de leurs préférences et des caractéristiques uniques de chaque actif, offrant une analyse plus personnalisée.

Logique derrière le choix de 30 % et 100 bougies :

Le choix soigneux du pourcentage et du nombre de bougies vise à capturer les mouvements pertinents du passé récent, offrant une projection plus précise. Cette approche stratégique met en évidence les zones où le prix a une probabilité significative de se déplacer, offrant une vision plus éclairée aux traders.

Avantages de l'ATR Projeção :

1. Précision technique personnalisable : Les utilisateurs ont la liberté de personnaliser les métriques, les adaptant aux conditions spécifiques de chaque actif négocié.

2. Mise en avant de la probabilité élevée : En se concentrant sur seulement 30 % de la moyenne des 100 dernières bougies, l'ATR Projeção dirige l'attention vers des mouvements présentant une probabilité élevée, optimisant la prise de décision éclairée.

3. Adaptation aux actifs négociés : La flexibilité de l'indicateur permet de s'ajuster à différents actifs, fournissant une analyse adaptée aux caractéristiques individuelles de chaque instrument financier.

Il est également important de souligner que l'ATR Projeção est convivial pour la création de robots de trading, utilisant les tampons 1 et 0, ce qui facilite son incorporation dans des stratégies automatisées. Cette caractéristique ajoute une dimension pratique et efficace à l'utilisation de l'indicateur dans les environnements de trading algorithmique. L'indicateur ATR Projeção, avec son adaptabilité et sa facilité d'intégration, se distingue comme un outil précieux pour les traders recherchant des analyses techniques personnalisables et efficaces.
Prodotti consigliati
Here I present you this awesome indicator I made. This is a nique combination witch puts you in the same level as MM's. So you can surf a lot of waves and identify the rally time, breakouts, and the perfect time to get in the market. ---- The SSL Channel is a great all-rounder based on 2 Simple Moving Averages, one of recent Highs, one of recent Lows. The calculation prints a   channel   on the chart consisting of 2 lines. This strategy gives a Long signal when price closes above the top of the
O  GRIDBOT WIM  robô de investimento para Mini Índice. Parametrizado com grade linear ou zona de expansão (FIMATHE). CONFIGURAÇÕES: Ponto de entrada Pivot dia anterior    double r1 = pivot + distance;    double r2 = r1 + distance;    double r3 = r2 + distance;    double r4 = r3 + distance;    double r5 = r4 + distance;    double r6 = r5 + distance;    double r7 = r6 + distance;    double r8 = r7 + distance;    double r9 = r8 + distance;    double r10 = r9 + distance;        double s1 = pivot
Your swiss army knife to ancipate price reversals This indicator anticipates price reversals analyzing bullish and bearish pressure in the market. The buying pressure is the sum of all the accumulation bars over a certain number of days, multiplied by the volume. The selling pressure is the sum of all of the distribution over the same number of bars, multiplied by the volume. It gives you a measure of the buying pressure as a percentage of the total activity, which value should fluctuate from 0
Rule Plotter Expert
Francisco Gomes Da Silva
5 (3)
Questo Expert Advisor è stato progettato per testare ed eseguire le tue strategie create all'interno dell'indicatore Rule Plotter . Come utilizzarlo: Scarica gratuitamente l'indicatore Rule Plotter - strumento per la creazione di sistemi di trading senza conoscenze di programmazione . Successivamente, sviluppa le tue strategie all'interno dell'indicatore Rule Plotter. Infine, esegui le tue strategie create utilizzando questo Expert Advisor. Parametri: Strategy Il tuo sistema di trading creato al
FREE
Touch VWAP MT5
Danrlei Hornke
5 (2)
O Touch VWAP é um indicador que permite calcular uma Média Ponderada por Volume (VWAP) apenas apertando a tecla 'w' no seu teclado e após clicando no candle do qual deseja realizar o calculo, clicando abaixo do candle é calculada a VWAP baseado na minima dos preços com o volume, clicando sobre o corpo do candle é calculado uma VWAP sobre o preço medio com o volume e clicando acima do candle é calculado uma VWAP baseado na máxima dos preços com o volume, voce tambem tem a opção de remover a VWA
FREE
Rocket Trend
Andriy Sydoruk
The Rocket Trend indicator is trending. The indicator draws two-color points connected by lines along the chart. This is a trend indicator, it is an algorithmic indicator. It is easy to work and understand when a blue circle appears, you need to buy, when a red one appears, sell. The indicator is used for scalping and pipsing, and has proven itself well. Rocket Trend is available for analyzing the direction of the trend for a specific period of time. Ideal for novice traders learning the laws o
Aliens dougkang de moviles
Cesar Juan Flores Navarro
Tomamos 5 medios móviles las unimos en una la cual suavizamos y volvemos a suavizar, resultando un mega suavizador de medios móviles suavizadas. Indicador de mql5 funciona en cualquier broker y para todos los tiempos, siendo el mas optimo el de 5, 15 a mas. Funciona mejor en grupo consigo misma osea poner uno de 14 y otro de 50 y 400,, así se observa mejor su desempeño.
Weis Waves Wyckoff
Fillipe Dos Santos
through this indicator you can make  analysis and also can to distinguish possible weakness or continuous strength  on  price, it is an indicator initially developed by David Weis. This version is for the meta trader 5 platform. The Weis Waves indicator is based on volume and is aligned with the price, being able to find not only possible strenght and weakness, but also possible divergences between price and volume, bringing an interesting analysis between both.
Swing Point Volume
Thalles Nascimento De Carvalho
Swing Point Volume, the indicator that signals weakness and strength at the tops and bottoms. This indicador can be for used the Wyckoff Method. Information provided; - Swing on customized ticks. - Volume and points in each balance sheet. - Percentage of Displacement. - Sound alert option on top and bottom breaks. - Volume in ticks and Real Volume. - Volume HL (extreme) or (opening and closing) - Customized volume shapes.
KT Horizontal Lines MT5
KEENBASE SOFTWARE SOLUTIONS
In MetaTrader, plotting multiple   horizontal lines   and then tracking their respective price levels can be a hassle. This indicator automatically plots multiple horizontal lines at equal intervals for setting price alerts, plotting support and resistance levels, and other manual purposes. This indicator is suitable for Forex traders who are new and looking for chances to make quick profits from buying and selling. Horizontal lines can help traders find possible areas to start trading when the
Introducing the 'No Nonsense Reversal Megaprofits' indicator for MetaTrader 5 (MT5), your ultimate tool for identifying trend reversals with precision and confidence. This powerful indicator is designed to cut through the noise of the markets and pinpoint crucial turning points with ease. Powered by advanced algorithms, 'No Nonsense Reversal Megaprofits' analyzes price action and key market dynamics to accurately detect when a trend is about to reverse. Whether you're a novice trader or a season
Product Description: Adaptive Y-Axis Scaling is a powerful MT5 indicator designed to enhance your trading experience by providing precise control over the Y-axis (price) scaling of your charts. This innovative tool allows you to customize the price scaling by specifying the number of pips from the visible chart's highs and lows. The calculated price range from this input is then used to set the maximum and minimum prices for the open chart, ensuring an optimized and comprehensive view of market
FREE
Intraday Vwap Orion
Joao Paulo Botelho Silva
Theory VWAP is a volume-weighted moving average, bringing greater relevance to prices. The VWAP base calculation follows the classic formula described in Investopedia ( https://www.investopedia.com/terms/v/vwap.asp ). VWAP = sum(typical price[i]*volume[i]) / sum(volume[i]) Functionalities Orion Intraday VWAP innovates by allowing the user to choose between the conventional Daily, Weekly and Monthly periods, also having the option of calculating the Intraday indicator, as used in other platfo
FRB Day Points
Fernando Baratieri
Day Points Indicadtor that shows the points considered important for X days. (Open,Close, High, Low) Used a lot by those who do day trade. These points can be used for decision making by a trader. You will choose the amount of days ago for it to show. Settings High/Low/Close/Open Show - True/False. Days - Number of days that will show on the chart. Color - Line Color. Style - Line Style.
FREE
Info:   marcobarbosabots Pivot lines are an easy way to see market trend. The indicator provides the pivot line and three first support and Resistance lines. Calculations used was: Resistance 3 = High + 2*(Pivot - Low) Resistance 2 = Pivot + (R1 - S1) Resistance 1 = 2 * Pivot - Low Pivot point = ( High + Close + Low )/3 Suport 1 = 2 * Pivot - High Suport 2 = Pivot - (R1 - S1) Suport 3 = Low - 2*(High - Pivot) You can use the calculated values ​​on an EA too, just make sure the indicator
Xtrade Trend Detector
Dago Elkana Samuel Dadie
Xtrade Trend Detector is an indicator capable of finding the best opportunities to take a position in any stock market. Indeed, it is a great tool for scalpers but also for Daytraders. You could therefore use it to identify areas to trade, it fits easily on a chart. I use it to detect trends on Big timeframes and take positions on Small timeframes. Don't hesitate to give me a feedback if you test it.
Graphic Alignment Context
Ricardo Alexandre Laurentino
The Graphic Alignment Context (GAC) Technical Indicator measures the vertical difference of the simple average price of a financial instrument in the context of three different timeframes determined by a defined number of bars or candles (periods) to determine the strength of the buy or sell trend. sale. Ascending average prices indicate Buying strength (1), Descending average prices indicate Selling strength (-1) and any scenario different from the previous two conditions indicates Neutrality
FREE
SupportResistence
Eduardo Borges Mariani
SupportResistance is a dynamic support and resistance indicator based on the high and low of the previous candles. The calculation parameters are configurable. You can use the maximum and minimum values of the previous candle as a reference, or you can use the maximum and minimum of a group of previous candles. The indicator uses a red line to indicate resistance and a green line to indicate support. When a support or resistance is broken, its line is dotted, being restored only when it b
Turpial Pullback
Arlos Elias Rivas Romero
Indicator Type Strategy (Pullback) for all Symbols and Periodicity, Preferably from 30M periodicity. Can be used for manual trading. Its workspace corresponds to channel of 3 bars of Bill Willians. Also relies on the indicator Rsi and Atr. BUY when: There is a Green Arrow STOPLOSS to buy, below the bottom line of the channel (red line)" SELL when: There is a Red Arrow. STOPLOSS to sell, above the upper line of the channel (blue line)
This indicator calculates and displays Murrey Math Lines on the chart. This MT5 version is similar to the МТ4 version: It allows you to plot up to 4 octaves, inclusive, using data from different time frames, which enables you to assess the correlation between trends and investment horizons of different lengths. In contrast to the МТ4 version, this one automatically selects an algorithm to search for the base for range calculation. You can get the values of the levels by using the iCustom() funct
To download MT4 version please click here . This is the exact conversion from TradingView: "WaveTrend [LazyBear]" By "zeusuk3". One of the coolest indicators out there to detect overbought and oversold zones. It can be used as a part of more complicated strategy and for confirming a potential trade setup. There are buffers to use in EAs also. The indicator is loaded light and non-repaint. - You can message in private chat for further changes you need. Thanks for downloading 
Parabolic Profesional
Ignacio Agustin Mene Franco
Parabolic Professional. is a parabolic sar indicator, programmed better to better catch the entries, where it throws red dots, gives upload input, where it puts gray dots, gives point of sale, perfect for making lengths of H4, and H1 It is also used for scalping, It works at any time. suitable for forex and synthetic indices, also crypto, World Investor , Good profit
Alert Up Down MT5
William Oswaldo Mayorga Urduy
ALERT UP - DOWN FOR METATRADER 5 This indicator generates an alert when the price leaves the zone between the UP and DOWN lines. You can generate alerts of various types such as: > Sound > Message box > Message in the expert box > Mail (previously configured) > PUSH notifications (previously configured) The lines must be configured from the indicator properties and not from the lines properties, since if it is done from the lines properties, the finonacci may be affected.
Expert Market Edge is scalping, trending, reversal indicator, with alerts . You can use it all and fit with your strategy whatever it fits you. My recommendation is to combine with my Colored RSI , and when 2 signals are matched, and pointing same direction (for example buy on this indicator, and green on RSI, you can take a long position, stop loss should be last local low, if you want to be more conservative, add ATR. ) you can take position. If you using moving averages, that's even better i
MIDAS Super VWAP
Flavio Javier Jarabeck
4.44 (9)
Imagine VWAP, MVWAP and MIDAS in one place... Well, you found it! Now you can track the movement of Big Players in various ways, as they in general pursue the benchmarks related to this measuring, gauging if they had good execution or poor execution on their orders. Traders and analysts use the VWAP to eliminate the noise that occurs throughout the day, so they can measure what prices buyers and sellers are really trading. VWAP gives traders insight into how a stock trades for that day and deter
FREE
Pare de seguir as "sardinhas" e comece a operar como big player, de forma automática. O robô Imbalance Autotrader é a mais recente tecnologia de trade que monitora os big players (grandes investidores) do mercado financeiro. Com estratégia de rompimento ( breakout ) ou pullback (Fair Value Gap FVG e Order Block) , você consegue configurar o robô para o ativo, conforme condições que você deseja operar. Além disso, o robô pode ter stops configuráveis, dinâmicos ou fixos. Na questão de gerenciamen
Zone vwap auto band
Anizio Donizete Dias De Moraes
It is an indicator used to identify support and resistance points from the daily VWAP and you can use it to check the best entry and exit points. The calculated value of the channel distance can be calculated in several ways: - Manual   Defining the value to be projected to calculate the distance of the channels. - Automatic   Select the timeframe to be used.   Regardless of the graphic time that is on the screen, if the parameter is changed to      H1(One hour candles), the system will c
Stackable VWAP
Flavio Javier Jarabeck
3.5 (4)
Volume Weighted Average Price (VWAP) is a trading benchmark commonly used by Big Players that gives the average price a Symbol has traded throughout the day. It is based on both Volume and price. Additionally we put in this indicator the MVWAP (Moving Volume Weighted Average Price). For those who do not know the usage and the importance od this indicator I recommend a great article about this subject at Investopedia ( https://www.investopedia.com/articles/trading/11/trading-with-vwap-mvwap.asp
FREE
RSIScalperPro
PATRICK WENNING
Introducing RSIScalperPro - the revolutionary RSI-based indicator for Metatrader 5, specifically designed for scalping in the one-minute chart. With RSIScalperPro, you'll have a powerful toolkit for precise entry and exit signals to take your trading to the next level. RSIScalperPro utilizes two different RSI indicators that provide clear signals for overbought and oversold areas. You can customize the time periods and limit values of the two RSIs according to your preferences to achieve the be
ZigZag with Fibonacci
Rafael Caetano Pinto
This indicator uses the metaquotes ZigZag indicator as base to plot fibonacci extension and fibonacci retracement based in the Elliot waves. A fibonacci retracement will be plotted on every wave draw by the ZigZag. A fibonacci extension will be plotted only after the 2nd wave. Both fibonacci will be updated over the same wave tendency. Supporting until 9 consecutive elliot waves. Parameters: Depth: How much the algorithm will iterate to find the lowest and highest candles Deviation: Amoun
Gli utenti di questo prodotto hanno anche acquistato
TPSpro RFI Levels MT5
Roman Podpora
4.73 (11)
ISTRUZIONI       RUS   -   INGLESE       Si   consiglia di utilizzare con un indicatore       -       TPSpro   TENDENZA PRO -   Versione MT4         Un elemento chiave nel trading sono le zone o i livelli da cui vengono prese le decisioni di acquisto o vendita di uno strumento di trading. Nonostante i tentativi dei principali attori di nascondere la loro presenza sul mercato, lasciano inevitabilmente delle tracce. Il nostro compito era imparare a identificare queste tracce e interpretarle corre
TPSproTREND PrO MT5
Roman Podpora
4.89 (9)
TPSpro TREND PRO   è un indicatore di tendenza che analizza automaticamente il mercato, fornisce informazioni sulla tendenza e sui rispettivi cambiamenti e fornisce segnali per entrare nelle operazioni senza ridisegnare. L'indicatore utilizza ciascuna candela e la analizza separatamente. Si riferisce a vari shock al rialzo o al ribasso. Punto di ingresso preciso per il trading di valute, criptovalute, metalli, azioni e indici! Versione MT5                   Descrizione completa dell'indicatore
Atomic Analyst MT5
Issam Kassas
4.42 (19)
Innanzitutto, vale la pena sottolineare che questo indicatore di trading non è repaint, non è ridisegno e non presenta ritardi, il che lo rende ideale sia per il trading manuale che per quello automatico. Manuale utente: impostazioni, input e strategia. L'Analista Atomico è un indicatore di azione del prezzo PA che utilizza la forza e il momentum del prezzo per trovare un miglior vantaggio sul mercato. Dotato di filtri avanzati che aiutano a rimuovere rumori e segnali falsi, e aumentare il pote
Innanzitutto è importante sottolineare che questo sistema di trading è un indicatore Non-Repainting, Non-Redrawing e Non-Lagging, il che lo rende ideale sia per il trading manuale che per quello automatico. Corso online, manuale e download di preset. Il "Sistema di Trading Smart Trend MT5" è una soluzione completa pensata sia per i trader principianti che per quelli esperti. Combina oltre 10 indicatori premium e offre più di 7 robuste strategie di trading, rendendolo una scelta versatile per div
Quantum Trend Sniper
Bogdan Ion Puscasu
4.8 (49)
Presentazione       Quantum Trend Sniper Indicator   , l'innovativo indicatore MQL5 che sta trasformando il modo in cui identifichi e scambi le inversioni di tendenza! Sviluppato da un team di trader esperti con un'esperienza di trading di oltre 13 anni,       Indicatore Quantum Trend Sniper       è progettato per spingere il tuo viaggio di trading verso nuove vette con il suo modo innovativo di identificare le inversioni di tendenza con una precisione estremamente elevata. *** Acquista Quant
Questo cruscotto mostra gli ultimi   pattern armonici   disponibili per i simboli selezionati, in modo da risparmiare tempo ed essere più efficienti /   versione MT4 . Indicatore gratuito:   Basic Harmonic Pattern Colonne dell'indicatore Symbol :   vengono visualizzati i simboli selezionati Trend:   rialzista o ribassista Pattern:   tipo di pattern (gartley, butterfly, bat, crab, shark, cypher o ABCD) Entry:   prezzo di ingresso SL:   prezzo di stop loss TP1:   1 prezzo di take profit TP
FX Power MT5 NG
Daniel Stein
5 (5)
Ricevi il tuo aggiornamento quotidiano sul mercato con dettagli e schermate tramite il nostro Morning Briefing qui su mql5 e su Telegram ! FX Power MT5 NG è la nuova generazione del nostro popolare misuratore di forza delle valute, FX Power. Cosa offre questo misuratore di forza di nuova generazione? Tutto ciò che avete amato dell'FX Power originale IN PIÙ Analisi della forza di ORO/XAU Risultati di calcolo ancora più precisi Periodi di analisi configurabili individualmente Limite di calcolo pe
Innanzitutto, vale la pena sottolineare che questo Strumento di Trading è un Indicatore Non-Ridipingente, Non-Ridisegnante e Non-Laggante, il che lo rende ideale per il trading professionale. Corso online, manuale utente e demo. L'Indicatore Smart Price Action Concepts è uno strumento molto potente sia per i nuovi che per i trader esperti. Racchiude più di 20 utili indicatori in uno solo, combinando idee di trading avanzate come l'Analisi del Trader del Circolo Interno e le Strategie di Trad
AT Forex Indicator MT5
Marzena Maria Szmit
5 (4)
The AT Forex Indicator MT5 is a sophisticated trading tool designed to provide traders with a comprehensive analysis of multiple currency pairs. This powerful indicator simplifies the complex nature of the forex market, making it accessible for both novice and experienced traders. AT Forex Indicator uses advanced algorithms to detect trends, patterns and is an essential tool for traders aiming to enhance their forex trading performance. With its robust features, ease of use, and reliable signal
TrendMaestro5
Stefano Frisetti
nota: questo indicatore e' per METATRADER5, se vuoi la versione per  METATRADER4 questo e' il link:   https://www.mql5.com/it/market/product/108106 TRENDMAESTRO ver 2.4 TRENDMAESTRO   riconosce un nuovo TREND sul nascere, non sbaglia mai. La sicurezza di identificare un nuovo TREND non ha prezzo. DESCRIZIONE TRENDMAESTRO identifica un nuovo TREND sul nascere, questo indicatore prende in esame la volatilita' i volumi ed il momentum per identificare il momento in cui c'e' un'esplosione di uno
TPA True Price Action indicator reveals the true price action of the market makers through 100% non-repainting signals strictly at the close of a candle! TPA shows entries and re-entries, every time the bulls are definitely stronger than the bears and vice versa. Not to confuse with red/green candles. The shift of power gets confirmed at the earliest stage and is ONE exit strategy of several. There are available now two free parts of the TPA User Guide for our customers. The first "The Basics"
FxaccurateLS
Shiv Raj Kumawat
WHY IS OUR FXACCCURATE LS MT5 THE PROFITABLE ? PROTECT YOUR CAPITAL WITH RISK MANAGEMENT Gives entry, stop and target levels from time to time. It finds Trading opportunities by analyzing what the price is doing during established trends. POWERFUL INDICATOR FOR A RELIABLE STRATEGIES We have made these indicators with a lot of years of hard work. It is made at a very advanced level. Established trends provide dozens of trading opportunities, but most trend indicators completely ignore them!
Auto Order Block with break of structure based on ICT and Smart Money Concepts (SMC) Futures Break of Structure ( BoS )             Order block ( OB )            Higher time frame Order block / Point of Interest ( POI )    shown on current chart           Fair value Gap ( FVG ) / Imbalance   -  MTF      ( Multi Time Frame )    HH/LL/HL/LH  -  MTF      ( Multi Time Frame )  Choch  MTF      ( Multi Time Frame )  Volume Imbalance     ,  MTF          vIMB Gap’s Power of 3 Equal High
Advanced Supply Demand MT5
Bernhard Schweigert
4.5 (14)
La migliore soluzione per qualsiasi principiante o trader esperto! Questo indicatore è uno strumento di trading unico, di alta qualità e conveniente perché abbiamo incorporato una serie di funzionalità proprietarie e una nuova formula. Con questo aggiornamento, sarai in grado di mostrare fusi orari doppi. Non solo potrai mostrare una TF più alta, ma anche entrambe, la TF del grafico, PIÙ la TF più alta: SHOWING NESTED ZONES. Tutti i trader di domanda di offerta lo adoreranno. :) Informazioni imp
Top indicator for MT5   providing accurate signals to enter a trade without repainting! It can be applied to any financial assets:   forex, cryptocurrencies, metals, stocks, indices .  Watch  the video  (6:22) with an example of processing only one signal that paid off the indicator! MT4 version is here It will provide pretty accurate trading signals and tell you when it's best to open a trade and close it. Most traders improve their trading results during the first trading week with the help of
Matrix Arrow Indicator MT5
Juvenille Emperor Limited
5 (12)
Matrix Arrow Indicator MT5   è un trend unico 10 in 1 che segue un indicatore multi-timeframe al   100% non ridipinto   che può essere utilizzato su tutti i simboli/strumenti:   forex ,   materie prime ,   criptovalute ,   indici ,   azioni .  Matrix Arrow Indicator MT5  determinerà la tendenza attuale nelle sue fasi iniziali, raccogliendo informazioni e dati da un massimo di 10 indicatori standard, che sono: Indice di movimento direzionale medio (ADX) Indice del canale delle materie prime (CCI
Blahtech Supply Demand MT5
Blahtech Limited
4.54 (13)
Was: $299  Now: $99   Supply Demand uses previous price action to identify potential imbalances between buyers and sellers. The key is to identify the better odds zones, not just the untouched ones. Blahtech Supply Demand indicator delivers functionality previously unavailable on any trading platform. This 4-in-1 indicator not only highlights the higher probability zones using a multi-criteria strength engine, but also combines it with multi-timeframe trend analysis, previously confirmed swings
Was: $249  Now: $99   Market Profile defines a number of day types that can help the trader to determine market behaviour. A key feature is the Value Area, representing the range of price action where 70% of trading took place. Understanding the Value Area can give traders valuable insight into market direction and establish the higher odds trade. It is an excellent addition to any system you may be using. Inspired by Jim Dalton’s book “Mind Over Markets”, this indicator is designed to suit the
PZ Swing Trading MT5
PZ TRADING SLU
5 (4)
Protect against whipsaws: revolutionize your swing trading approach Special Offer: Purchase now to receive free bonuses worth $135! (Read more for details) Swing Trading is the first indicator designed to detect swings in the direction of the trend and possible reversal swings. It uses the baseline swing trading approach, widely described in trading literature. The indicator studies several price and time vectors to track the aggregate trend direction and detects situations in which the market i
FX Volume MT5
Daniel Stein
4.93 (14)
Ricevi il tuo aggiornamento quotidiano sul mercato con dettagli e schermate tramite il nostro Morning Briefing qui su mql5 e su Telegram ! FX Volume è il PRIMO e UNICO indicatore di volume che fornisce una visione REALE del sentiment del mercato dal punto di vista del broker. Fornisce informazioni straordinarie su come gli operatori di mercato istituzionali, come i broker, sono posizionati sul mercato Forex, molto più velocemente dei rapporti COT. Vedere queste informazioni direttamente sul vo
Trade smarter, not harder: Empower your trading with Harmonacci Patterns Special Offer: Purchase now to receive free bonuses worth $165! (Read more for details) This is arguably the most complete harmonic price formation auto-recognition indicator you can find for the MetaTrader Platform. It detects 19 different patterns, takes fibonacci projections as seriously as you do, displays the Potential Reversal Zone (PRZ) and finds suitable stop-loss and take-profit levels. [ Installation Guide | Up
XQ Indicator MetaTrader 5
Marzena Maria Szmit
3 (2)
Step into the realm of Forex trading with confidence and precision using XQ, a cutting-edge Forex indicator designed to elevate your trading game to unprecedented heights. Whether you're a seasoned trader or just stepping into the world of currency exchange, XQ Forex Indicator empowers you with the insights and signals needed to make informed trading decisions. The signal conditions are a combination of three indicators, and XQ Forex Indicator only display  medium and long-term trends . The ind
Noize Absorption Index - is the manual trading system that measures the difference of pressure between bears forces and bulls forces. Green line - is a noize free index that showing curent situation. Zero value of index shows totally choppy/flat market.Values above zero level shows how powerfull bullish wave is and values below zero measures bearish forces.Up arrow appears on bearish market when it's ready to reverse, dn arrow appears on weak bullish market, as a result of reverse expectation.
Golden Spikes Premium
Kwaku Bondzie Ghartey
5 (1)
Golden Spikes Detector Acknowledgement and Dedications:  The name of this indicator was Inspired by an Original; Mr Grant Koopman; a Knowledgeable and experienced Synthetics trader. I dedicate this indicator to Mr Grant.  Overview: The Golden Spikes Premium is a groundbreaking trading indicator meticulously crafted for the Boom and Crash indices on the Deriv market. Tailored to meet the needs of discerning traders, this powerful tool operates exclusively on the one-minute timeframe, providin
Gold Trend 5
Sergei Linskii
5 (1)
Gold Trend - è un buon indicatore tecnico azionario. L'algoritmo dell'indicatore analizza il movimento del prezzo di un asset e riflette la volatilità e le potenziali zone di ingresso. I migliori segnali dell'indicatore: - Per VENDERE = istogramma rosso + puntatore SHORT rosso + freccia di segnale gialla nella stessa direzione. - Per l'ACQUISTO = istogramma blu + puntatore LONG blu + freccia di segnale acquatica nella stessa direzione. Vantaggi dell'indicatore: 1. L'indicatore produ
Questo cruscotto scopre e visualizza le zone di   domanda   e   offerta   sul grafico, sia in modalità scalping che a lungo termine, a seconda della vostra strategia di trading per i simboli selezionati. Inoltre, la modalità scanner del cruscotto vi aiuta a controllare tutti i simboli desiderati in un colpo d'occhio e a non perdere nessuna posizione adatta /   versione MT4 Indicatore gratuito:   Basic Supply Demand Caratteristiche Consente di visualizzare le opportunità di trading su pi
The Price Action Finder Multi indicator is an indicator of entry points that searches for and displays Price Action system patterns on dozens of trading instruments and on all standard time frames: (m1, m5, m15, m30, H1, H4, D1, Wk, Mn). The indicator places the found patterns in a table at the bottom of the screen. By clicking on the pattern names in the table, you can move to the chart where this pattern is located. Manual (Be sure to read before purchasing) | Version for MT4 Advantages 1. Pa
Automated Trendlines MT5
Georgios Kalomoiropoulos
Le linee di tendenza sono lo strumento più essenziale di analisi tecnica nel forex trading. Sfortunatamente, la maggior parte dei trader non li disegna correttamente. L'indicatore automatizzato delle linee di tendenza è uno strumento professionale per i trader seri che ti aiuta a visualizzare il movimento di tendenza dei mercati. Esistono due tipi di linee di tendenza, linee di tendenza rialziste e linee di tendenza ribassiste. Nella tendenza rialzista, la linea di tendenza Forex viene t
MetaForecast M5
Vahidreza Heidar Gholami
5 (2)
MetaForecast predice e visualizza il futuro di qualsiasi mercato basandosi sull'armonia dei dati dei prezzi. Sebbene il mercato non sia sempre prevedibile, se esiste un modello nei prezzi, MetaForecast può prevedere il futuro con la massima precisione possibile. Rispetto ad altri prodotti simili, MetaForecast può generare risultati più accurati analizzando le tendenze di mercato. Parametri di input Past size (Dimensione passata) Specifica il numero di barre che MetaForecast utilizza per creare
Market Overview MT5
Mehran Sepah Mansoor
Ottimizzate le vostre decisioni di trading con il nostro indicatore di forza e sentimento del mercato e non fate più trading controcorrente! Meticolosamente progettato per i trader seri che apprezzano informazioni accurate e tempestive, il nostro indicatore fornisce una visione a volo d'uccello delle 28 coppie principali in modo molto semplice. Questo strumento è in grado di classificare le coppie di valute in base alla popolarità, alla forza del trend rialzista o ribassista e alla percentual
Altri dall’autore
SwingVolumePro
Thalles Nascimento De Carvalho
Panoramica SwingVolumePro è un indicatore avanzato e versatile, progettato per essere utilizzato su una vasta gamma di strumenti finanziari e per supportare diversi stili di trading. Basato su un'analisi rigorosa di volume e prezzo, fornisce segnali chiari e precisi che consentono ai trader di tutti i livelli di prendere decisioni informate basate su dati di alta qualità. SwingVolumePro.PDF Caratteristiche principali Versatilità: SwingVolumePro può essere applicato a vari asset, t
Box Weis Wave
Thalles Nascimento De Carvalho
5 (1)
Eleva la tua analisi con Weis Wave Box! Se stai cercando precisione e chiarezza nel tuo trading, Weis Wave Box è lo strumento che fa per te. Questo indicatore avanzato offre un'analisi visiva dettagliata delle onde di volume e dei punti di swing, aiutandoti a comprendere meglio la relazione tra sforzo e risultati nel mercato. Caratteristiche principali di Weis Wave Box: Onde di Volume Personalizzabili: Regola le onde di volume in tick per adattarle alle tue strategie di trading. Stori
AI Channel
Thalles Nascimento De Carvalho
4 (4)
Welcome to the presentation of the AI Channel indicator, a powerful tool that uses artificial intelligence for price channel analysis in the financial market. In this session, we will explore how this revolutionary indicator can assist investors and traders in making more informed and strategic decisions. Let's get started! I. What is the AI Channel indicator? AI Channel is an indicator developed based on advanced artificial intelligence algorithms. It utilizes historical price data of financial
FREE
Cumulative Volume Bands
Thalles Nascimento De Carvalho
CVB Cumulative Volume Bands: Potenzia le tue operazioni con il volume accumulato! CVB Cumulative Volume Bands è un indicatore avanzato progettato per i trader che cercano segnali precisi basati sul volume accumulato. Utilizzando bande di volume accumulato, questo indicatore offre letture chiare delle pressioni di acquisto e vendita nel mercato, aiutando a identificare inversioni e forti movimenti dei prezzi. Cumulative Volume Bands for MT5 ! Caratteristiche principali: Analis
FREE
Swing Point Volume
Thalles Nascimento De Carvalho
Swing Point Volume, the indicator that signals weakness and strength at the tops and bottoms. This indicador can be for used the Wyckoff Method. Information provided; - Swing on customized ticks. - Volume and points in each balance sheet. - Percentage of Displacement. - Sound alert option on top and bottom breaks. - Volume in ticks and Real Volume. - Volume HL (extreme) or (opening and closing) - Customized volume shapes.
Long Short Pro
Thalles Nascimento De Carvalho
Indicatore Long & Short - Versione Pro: Sblocca il Potenziale Illimitato della Tua Analisi di Mercato! Nessuna Limitazione per Qualsiasi Attivo La versione Pro dell’indicatore Long & Short ti offre la libertà totale di utilizzarlo su qualsiasi strumento finanziario. Niente più limitazioni – applica lo stesso indicatore a tutti i tuoi attivi preferiti! Senza Limitazioni Approfitta di tutte le funzionalità dell’indicatore senza alcuna restrizione. La versione Pro offre un’esperienza
Didi Index Volume
Thalles Nascimento De Carvalho
Presentiamo il Didi Index Volume, un indicatore di analisi tecnica sviluppato dal trader brasiliano Odir Aguiar, che si distingue per il suo approccio avanzato e potente nell'individuazione delle opportunità nei mercati finanziari. Disponibile su diverse piattaforme, il Didi Index Volume è diventato uno strumento essenziale per i trader che cercano informazioni precise e preziose per le loro strategie di trading. L'indicatore combina il rinomato Didi Index, creato da Odir Aguiar, con l'intell
Smart Binary Volume
Thalles Nascimento De Carvalho
L'indicatore Smart Binary Volume è uno strumento versatile che combina l'analisi del volume di trading con l'apprendimento automatico (machine learning). Può essere applicato su diversi mercati e strategie, inclusi lo scalping e altre tipologie di trading a breve termine. Utilizzando algoritmi avanzati di machine learning, l'indicatore identifica pattern complessi, generando segnali di acquisto e vendita più precisi. Buffer to Create EA. Buffer Line Gold = 0. Buffer Line Red = 2 Buffer   AI 
TimeChannel
Thalles Nascimento De Carvalho
The "Timechannel" is a powerful technical analysis tool designed specifically for traders who want to gain deeper and more accurate insights into price movements across multiple timeframes (multi-timeframe). This indicator is an essential addition to the toolbox of any serious trader seeking to make informed and data-driven trading decisions. Key Features: Advanced Multi-Timeframe Analysis : Timechannel allows traders to analyze price movements on different timeframes simultaneously. This is cr
Big Player Range
Thalles Nascimento De Carvalho
5 (2)
Scopri la Potenza di "BigPlayerRange": Il Tuo Alleato nell'Analisi Tecnica del Mercato Presentiamo BigPlayerRange , uno strumento avanzato di analisi tecnica progettato per rivelare le aree di interesse degli investitori istituzionali sul mercato. Con questo strumento, potrai identificare con precisione dove i principali attori sono attivamente coinvolti e comprendere come ciò possa influenzare le tue strategie di trading. Caratteristiche Principali: Mappatura delle Aree di Interesse Istitu
Master OBV
Thalles Nascimento De Carvalho
MasterOBV: Domina le Tendenze di Mercato con Precisione! MasterOBV è un indicatore di analisi tecnica che combina volume , correlazione positiva e una Media Mobile (MA) per affinare l'identificazione delle tendenze sui mercati finanziari. Funzionalità Principali: Volume Intelligente: Analizza il volume delle transazioni per identificare cambiamenti significativi nella forza della tendenza. Correlazione Positiva: Include asset correlati per ottenere una visione più ampia e precisa, ra
Smart Delta Volume
Thalles Nascimento De Carvalho
Smart Delta Volume: Preciso e Adattabile alle Condizioni Dinamiche del Mercato Smart Delta Volume è un indicatore tecnico avanzato progettato per offrire un'analisi precisa e adattabile in un ambiente di mercato in continua evoluzione. Utilizzando livelli dinamici che si regolano automaticamente in base alla volatilità, questo indicatore fornisce una visione più completa e affidabile dell'interazione tra flusso di volume e azione dei prezzi. Questa capacità di adattamento è cruciale per i tra
VolaMetrics VSA
Thalles Nascimento De Carvalho
VolaMetrics VSA | Un Potente Alleato nell'Analisi Tecnica Il VolaMetrics VSA è un indicatore di analisi tecnica che combina il metodo Volume Spread Analysis (VSA) con un'analisi dettagliata del volume delle transazioni . Progettato per identificare e tracciare i movimenti significativi dei prezzi , il VolaMetrics VSA utilizza l'interazione tra volume e spread dei prezzi per fornire intuizioni preziose che possono aiutare nelle decisioni di trading. Fondamenti della Volume Spread Analysis (VSA
CVD SmoothFlow Pro
Thalles Nascimento De Carvalho
CVD SmoothFlow Pro - Analisi del Volume Illimitata per Qualsiasi Attivo! CVD SmoothFlow Pro è la soluzione definitiva per i trader che cercano un'analisi del volume precisa e illimitata. Utilizzando il calcolo del Cumulative Volume Delta (CVD) con filtraggio avanzato del rumore, la versione Pro offre la flessibilità e la precisione necessarie per operare su qualsiasi strumento finanziario. Cosa offre CVD SmoothFlow Pro? Analisi Chiara : Filtra il rumore di mercato e mette in risalto i movi
VolumeSecret
Thalles Nascimento De Carvalho
VolumeSecret: Il Potere del Volume nelle Tue Mani Nel mondo sfidante della programmazione, affrontiamo costantemente ostacoli che ci spingono a crescere e ad evolverci. Comprendiamo profondamente le difficoltà imposte dal mercato e come i trader lottano per raggiungere le migliori performance. Per questo motivo, lavoriamo instancabilmente su soluzioni innovative per rendere la presa di decisioni sul mercato più fluida e precisa. VolumeSecret è il risultato di questo impegno. Si tratta di un indi
Imbalance DOM Pro
Thalles Nascimento De Carvalho
Imbalance DOM Pro: Potenzia le tue operazioni con il disequilibrio del libro ordini Opportunità nei piccoli movimenti di prezzo Imbalance DOM Pro è uno strumento essenziale per gli analisti che operano con il flusso degli ordini . Perfetto per i scalper , è stato progettato per coloro che desiderano sfruttare le piccole oscillazioni di prezzo con alta precisione. Con un calcolo avanzato, l'indicatore identifica i disequilibri nel libro ordini , fornendo segnali preziosi per entrate e u
Cumulative Vol Bands
Thalles Nascimento De Carvalho
CVB Cumulative Volume Bands: Potenzia le tue operazioni con il volume accumulato! CVB Cumulative Volume Bands è un indicatore avanzato progettato per i trader che cercano segnali precisi basati sul volume accumulato. Utilizzando bande di volume accumulato, questo indicatore offre letture chiare delle pressioni di acquisto e vendita nel mercato, aiutando a identificare inversioni e forti movimenti dei prezzi. Caratteristiche principali: Analisi del Volume Accumulato : Rileva i punt
ZigWave Oscillator
Thalles Nascimento De Carvalho
ZigWave Oscillator: Potenzia le tue operazioni con oscillatori e ZigZag! Il ZigWave Oscillator è lo strumento perfetto per i trader che cercano precisione e chiarezza nell'analisi del mercato finanziario. Questo indicatore combina la forza degli oscillatori con la semplicità visiva dello ZigZag, aiutandoti a identificare le migliori opportunità di acquisto e vendita con rapidità ed efficienza. Perché scegliere il ZigWave Oscillator? Analisi precisa degli oscillatori : Integra RSI, Will
Filtro:
Nessuna recensione
Rispondi alla recensione