Trend Map
- Indicatori
- Maryna Shulzhenko
- Versione: 1.0
- Attivazioni: 5
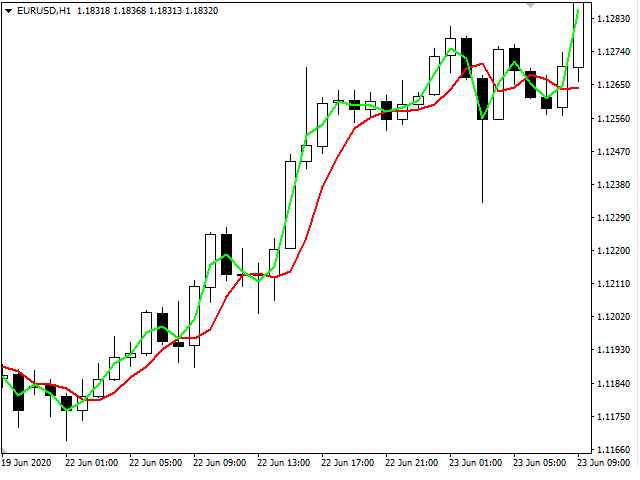
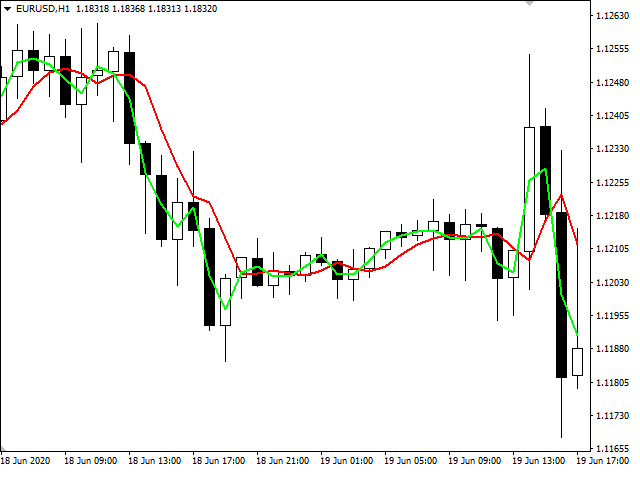
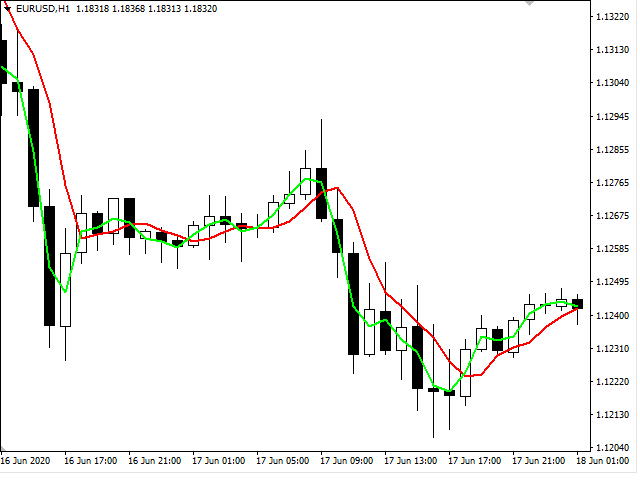
The Trend Map indicator is designed to detect trends in price movement and allows you to quickly determine not only the direction of the trend, but also to understand the levels of interaction between buyers and sellers. It has no settings and therefore can be perceived as it signals. It contains only three lines, each of which is designed to unambiguously perceive the present moment. Line # 2 characterizes the global direction of the price movement. If we see that the other two lines are above this line, then we can say that an uptrend is being formed, if otherwise, we should consider the situation for sales, which occurs when the blue line crosses the red line from top to bottom. The buying situation is characterized by the crossing of the red line by the blue line from bottom to top and the location of line # 2 below this crossing.

