MACD divergence signals
- Indicatori
- Kaijun Wang
- Versione: 1.30
- Aggiornato: 30 aprile 2021
- Attivazioni: 5
MACD is called Convergence and Divergence Moving Average, which is developed from the double exponential moving average. The fast exponential moving average (EMA12) is subtracted from the slow exponential moving average (EMA26) to get the fast DIF, and then 2× (Express DIF-DIF's 9-day weighted moving average DEA) Get the MACD bar. The meaning of MACD is basically the same as the double moving average, that is, the dispersion and aggregation of the fast and slow moving averages characterize the current long-short status and the possible development trend of stock prices, but it is more convenient to read. The change of MACD represents the change of market trend, and the MACD of different K-line levels represents the buying and selling trend in the current level cycle.
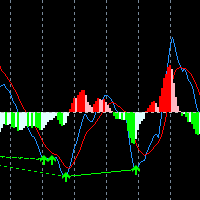
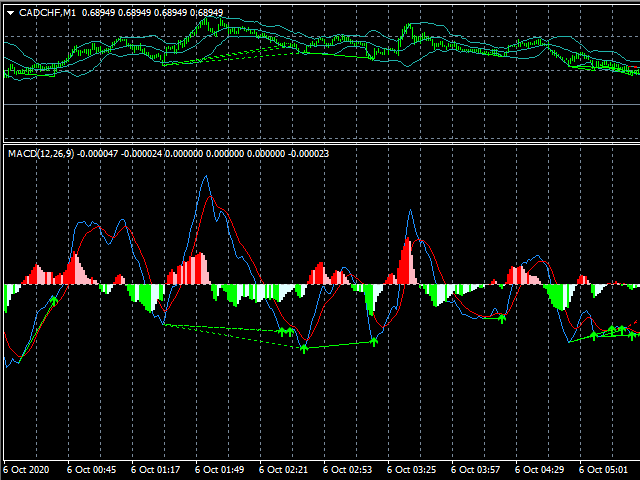
1. This indicator adds the two-line display of MACD,
2. And apply 4 different gradients to the energy column!
3. Increased MACD deviation signal display and prompt
Cooperation QQ:556024"
Cooperation wechat:556024"
Cooperation email: 556024@qq.com"


Look promising. I will update after a month.