ATR Moving Average
- Indicatori
- David Gitau Gakunga
- Versione: 1.1
- Aggiornato: 10 giugno 2021
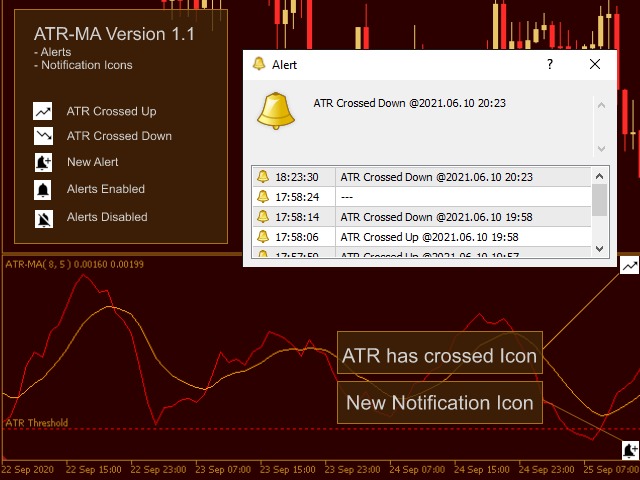
ATR Moving Average draws a moving average of the standard Average True Range( ATR ) in the same window.
Settings
| Name | Description |
|---|---|
| ATR period | Set Price period for ATR calculation |
| ATR level | Set ATR value for thresholding( only whole number, ignore leading zeros e.g. 0.00089 = 89 ) |
| MA Period | Set moving Average Period |
| MA Method | Set moving average method( Simple, Exponential, Smoothed and Linear Weighted ) |
| MA Shift | Set moving average shift |
| Enable Alerts ? | Generate Alert when ATR crosses Moving Average |
| Enable Icons ? | Show Alert Icons |
Example Use
Volatility Filter
The ATR is a technical analysis indicator that measures market volatility by decomposing the entire range of an asset price for that period. Higher ATR values means higher market volatility.
By thresholding these values, we can create a filter that shows when the market is volatile.
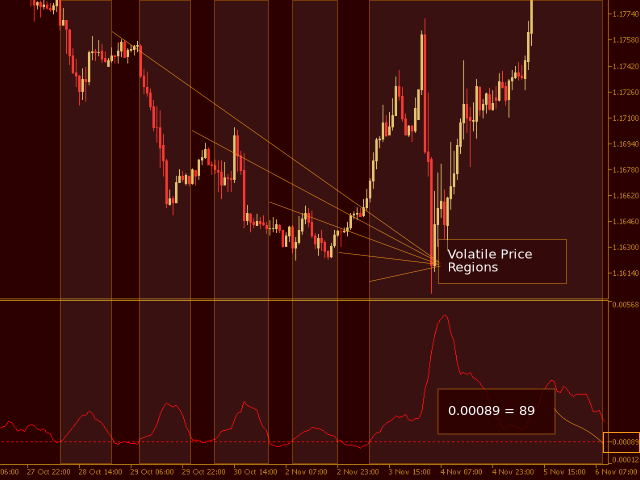
Method 1 :
a. Identify a region on chart where the market is less volatile( price is moving slowly or sideways ).
b. Check the ATR value e.g 0.00089
c. Set the ATR level to the whole number starting on right, ignore leading zeros .e.g 0.00089 = 89
Every time the ATR value is above the threshold then the price movement must be more volatile than the region we started with in a.
The points where the ATR crosses the level can be used to generate signals.
This method is useful if you want to filter volatility when you have specific ATR values.
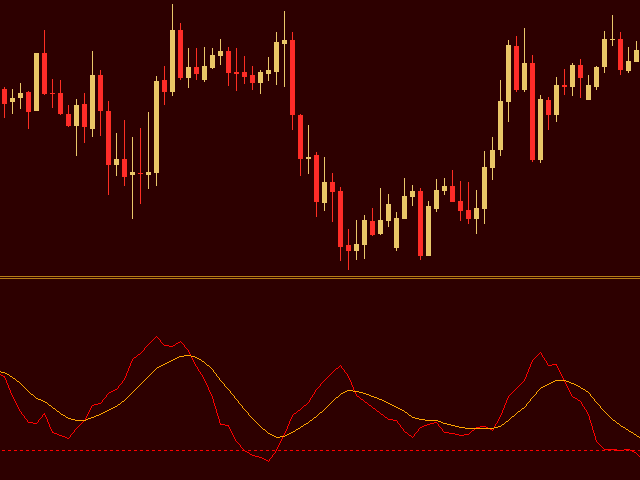
Method 2:
a. Identify a region on the chart where the market is volatile( price is increasing or decresing rapidly ).
b. Identify the number of candles( period ) in the region e.g. 5
c. Set ATR MA Period to this number and ATR Period to a higher number e.g 10
Every time the moving average( ATR MA ) is above the ATR the market is volatile for the given period.
The points where the ATR and MA cross can be used to generate signals.
This method is useful if you want to filter volatility without specific ATR values.
//---
For MT4 : ATR Moving Average MT4
//---
Enjoy


VERY HELPFUL . THANKS