Quant Stress Scanner
- Indicatori
- Philip Pankaj Suthagar
- Versione: 1.20
- Aggiornato: 16 ottobre 2023
- Attivazioni: 10
The Knowledge of which Geometry aims is the knowledge of the Eternal - Plato
So, now what is Quant Stress Scanner is all about?
I have formulated a score with volume, price and regressive trendlines to create an bull/bear stress score for the underlying asset/symbol.
*As the bull score increases at certain ratio with bear ratio ">" signal appears, it confirms a buy deal can be placed in the underlying asset/symbol.
*As the bear score increases at certain ratio with bull ratio "<" signal appears, it confirms a sell deal can be placed in the underlying asset/symbol.Structures classified: (Line structures i.e) Trendline, support and resistance level and regression lines)
1.Stress Repulsion.
2.Stress Fracture.
3.Stress Cluster.
Now the main question.
How To Trade?
Execute your trades in 2 Easy Steps!
Step 1: Trade Setup
Identify the Lines structure as per the classification as shown in video.
Step 2: Trade Entry
Step One 1: Stop loss Price – Recent Swing low/High for buy/sell (of recent candlesticks).
Step One 2: Take Profit Price - Maintain 2:1 ratio or greater.
For Buy – Entry Level + 2*(Entry Level – Recent Low).
For Sell – Entry Level + 2*(Entry Level – Recent High).
Benefits You Get
Quickly identify the trade signals of Assets/Symbols.
Enter the trend at the right time.
Analyze Multiple Timeframes & Multiple Symbols on one chart.
This Indicator is the Ideal combination with any trading strategy.
Never repaints, never back paints, never recalculates.
Works in all symbols and all timeframes.
Integrated pop-up, email, push notification, and sound alerts.
Parameters
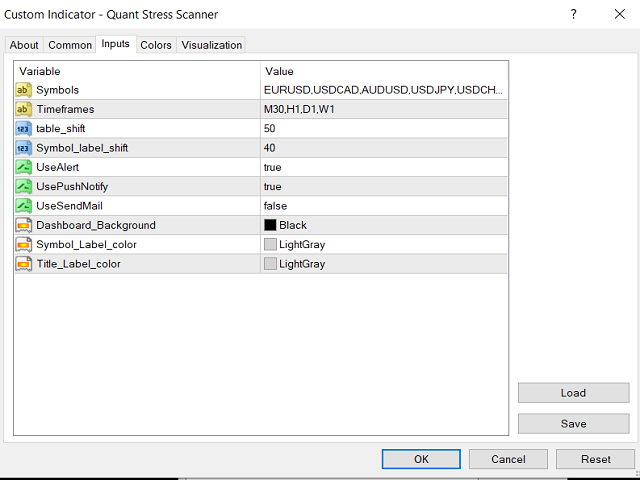
Symbols Parameters - Add multiple number of symbols separated with comma(",").
Time-Frame Parameters - Add multiple number of Timeframe seperated with comma(",").
M1 - 1minute
M5 - 5 minute
M15 - 15 minute
M30 - 30 minute
H1 - 1 hour
H4 - 4 hour
D1 - 1 day
W1 - 1 week
MN1 - 1 month
Position Parameters - controls the position of objects drawn on the chart.
Graphics Parameters - controls the appearance and colors of drawn objects on the chart.
Alert Parameters - controls the alert options enabled.


