• Panoramica
  • Recensioni
  • Commenti

Utilities

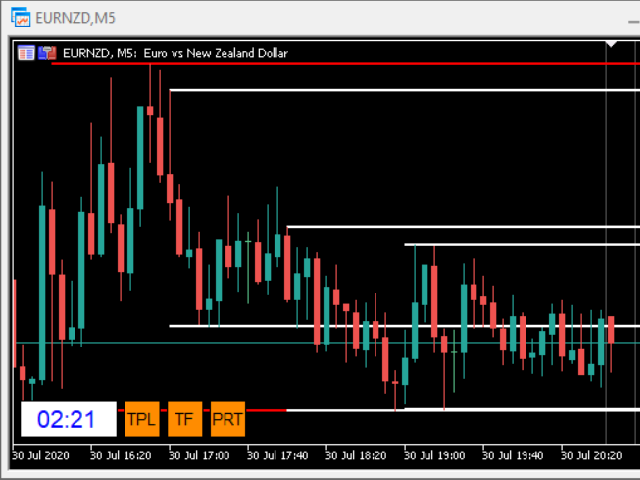
Indicator with 3 features

- Clock: Clock independent of the chart, counting continues even when the market is closed.

- Template: After setting up a configuration in any graphic, be it color patterns, indicators, zoom ... The configuration will be copied to all active graphics.

- TimeFrame: Set the TimeFrame on a chart, and with just one click all the active charts will be changed to the same TimeFrame.
Prodotti consigliati
Aussenstab Markttechnik
Alexander Josef Zeidler
This indicator shows external bars ("Aussenstäbe") in the chart in candle form. The colors of the candles can be set individually. Also different colors for bearish and bullish bars are possible. In addition, the color of the wicks or outlines is also adjustable. Outside bars are mentioned e.g. by Michael Voigt in the book "Das große Buch der Markttechnik". All other candles are inner bars.
--- StudentK Sync Chart --- 1. Move charts at the same time 2. Cross check among different Symbols and Timeframes 3. Plan your own trading strategies --- Context --- StudentK is not indicated as a master or K Sir for knowledgeable person who claims for winning all the time. (But lots of traders should know the fact that it is rarely truth, especially in fluctuated period of time) StudentK is a group of years-experienced traders who want to share amazing tools in Free and Paid versions. Aiming
The Market Structures Pro indicator finds and displays 5 (five) patterns of the Smart Money Concepts (SMC) system on the chart, namely: Break Of Structures (BoS)       Change of character (CHoCH) Equal Highs & Lows Premium, Equilibrium and Discount zones with Fibo grid High-high, Low-low, High-low and Low-high extremes Patterns are displayed for two modes - Swing and Internal and are easily distinguished by color on the chart. Internal mode features higher contrast colors, finer lines, and smal
Questo indicatore del dashboard di divergenza multi time frame e multi simbolo invia un avviso quando una o due divergenze diverse sono state identificate su più time frame e non su singole divergenze. Può essere utilizzato con tutte le fasce orarie da M1 a MN. È possibile visualizzare contemporaneamente nella dashboard un massimo di 9 intervalli di tempo. È possibile abilitare il filtro di tendenza della media mobile, dell'RSI o delle bande di Bollinger per filtrare solo le configurazioni più f
DM IND Exclusive
Sergio Vidal Prado
Indicador Para Opções Binarias. Indicator for Binary Options Usa dois gales. Instalar em mt5 Esse indicador é para ser usado no tempo de vela de 5 minutos e em M5. Este também funciona em M1, porém é mais eficiente em M5. Só descompactar e copiar os arquivos na pasta de dados do seu MT5. Arquivos indicator na pasta MQL5 - Indicator. Baixe também a Media Movel totalmente gratis: https://www.mql5.com/pt/market/product/50400 Esse Indicador é para a próxima vela. Apareceu a seta, só aguardar a próx
FRB Day Points
Fernando Baratieri
Day Points Indicadtor that shows the points considered important for X days. (Open,Close, High, Low) Used a lot by those who do day trade. These points can be used for decision making by a trader. You will choose the amount of days ago for it to show. Settings High/Low/Close/Open Show - True/False. Days - Number of days that will show on the chart. Color - Line Color. Style - Line Style.
Questo indicatore multi time frame e multi simbolo esegue la scansione di barre pin, stelle del mattino/sera, engulfing, pinzette, colpi a tre linee, barre interne e gagliardetti e triangoli.   L'indicatore può essere utilizzato anche in modalità grafico singolo. Si prega di leggere di più su questa opzione nel prodotto   blog .   Combinato con le tue regole e tecniche, questo indicatore ti consentirà di creare (o migliorare) il tuo potente sistema. Caratteristiche Può monitorare contemporaneame
L'esaurimento dell'intervallo si verifica quando il prezzo raggiunge o supera l'intervallo previsto per il periodo corrente. A questi livelli, il prezzo inizia a perdere slancio rispetto all'inizio del periodo, quindi è un buon punto per assicurarsi di non assumere nuove posizioni. Questo indicatore ti mostrerà dove è probabile che ciò accada sul tuo grafico, mostrando i livelli per periodi giornalieri, settimanali e mensili. Quando vedi che il prezzo supera questi livelli di esaurimento, ti sta
Four MA on OBV
Danton Dos Santos Sardinha Junior
Four MA on OBV - La tua guida definitiva al trading di successo! Scatena il vero potenziale delle tue operazioni con l'indicatore Four MA on OBV . Progettato esclusivamente per la piattaforma MetaTrader 5, questo potente indicatore combina quattro medie mobili con il Volume Bilanciato (OBV) per fornire segnali precisi e affidabili. Caratteristiche Tecniche: Quattro Medie Mobili: Integrazione di medie mobili semplici, esponenziali, smussate e lineari per un monitoraggio dettagliato delle tend
Santa Trend
Marco Aurelio Cestari
4.4 (5)
Santa Trend Indicator  is an efficient way to forecast and detect the trend in any market. Advantages Generates instant buy and sell signals. Provides an alternate exit strategy to your existing trading system. Never repaints, never backpaints, never recalculates. Works in all symbols and all timeframes. Perfect trend filter for any strategy or expert advisor. Fully compatible with Expert Advisor (EA) development. Does not lag.
FREE
L'indicatore "Haven Candle Timer Countdown" è uno strumento semplice e utile per i trader, che ti aiuta a tenere sotto controllo le finestre temporali di diversi intervalli di tempo. Mostra l'orario del server corrente e il conto alla rovescia fino alla fine delle candele su tre intervalli di tempo selezionati contemporaneamente. Questo strumento è particolarmente utile per i trader che hanno bisogno di sapere esattamente quanto tempo manca alla fine della candela attuale su più intervalli di te
FREE
Graphic Alignment Context
Ricardo Alexandre Laurentino
The Graphic Alignment Context (GAC) Technical Indicator measures the vertical difference of the simple average price of a financial instrument in the context of three different timeframes determined by a defined number of bars or candles (periods) to determine the strength of the buy or sell trend. sale. Ascending average prices indicate Buying strength (1), Descending average prices indicate Selling strength (-1) and any scenario different from the previous two conditions indicates Neutrality
FREE
Fibonacci automatically draws Fibonacci retracement, Because Fibonacci automatically draws Fibonacci retracement, you can know at a glance the price to buy at a push or sell back. Therefore, you can trade in favorable conditions in a trending market. We are live-streaming the actual operation of the system. Please check for yourself if it is usable. Please check it out for yourself. https://www.youtube.com/@ganesha_forex We do not guarantee your investment results. Investments should be made
RSIScalperPro
PATRICK WENNING
Introducing RSIScalperPro - the revolutionary RSI-based indicator for Metatrader 5, specifically designed for scalping in the one-minute chart. With RSIScalperPro, you'll have a powerful toolkit for precise entry and exit signals to take your trading to the next level. RSIScalperPro utilizes two different RSI indicators that provide clear signals for overbought and oversold areas. You can customize the time periods and limit values of the two RSIs according to your preferences to achieve the be
This easy to setup indicator shows you the market volumes in a different way, with support and resistance as showed. You can setup: - Backdays volume to show - Heiken Ashi candle view It works for every kind of graph and every kind of period. The program shows the volumes based on the number of candles displayed in the chart: the more candles the more volumes. Enjoy this very useful indicator. Please feel free to message me to report any kind of improvements! :D
The Beta index, also known as the Beta indicator, is one of the key reference indicators for hedging institutions. It allows you to measure the relative risk of individual assets, such as currencies and commodities, in comparison to market portfolios, cross-currency pairs, the U.S. dollar index, and stock indices. By understanding how your assets perform in relation to market benchmarks, you will have a clearer understanding of your investment risk. Key Features: Accurate Risk Assessment: The Be
Flag MT5
Dmitry Fedoseev
An indicator of patterns #21, #22, #23 ("Flag") from Encyclopedia of Chart Patterns by Thomas N. Bulkowski. Parameters: Alerts - show alert when an arrow appears Push - send a push notification when an arrow appears (requires configuration in the terminal) PeriodBars - period in bars K - an additional parameter that influences the accuracy of pattern shape recognition. The influence of the parameter will be visible if not all of the pattern variants are enabled (not all three parameters Expandin
Questo indicatore multi time frame e multi simbolo identifica formazioni alto/basso doppie o triple o un successivo breakout della scollatura (confermato alto/basso). Offre RSI, pin bar, engulfing, tweezer, filtri a stella del mattino/sera e opzioni di filtro di divergenza che consentono di filtrare solo le configurazioni più forti.       L'indicatore può essere utilizzato anche in modalità grafico singolo. Si prega di leggere di più su questa opzione nel prodotto   blog .   Combinato con le tue
Percentage Oscillator
Alexandre Borela
5 (1)
Se ti piace questo progetto, lascia una recensione a 5 stelle. Come le istituzioni commerciano grandi volumi, non è raro per loro cercare di difendere la loro posizione a livelli percentuali specifici. Questi livelli serviranno come supporto naturale e resistenza che è possibile utilizzare o entrare in un commercio o essere a conoscenza di possibili pericoli contro la vostra posizione. Questo oscillatore vi mostrerà la variazione percentuale per il: Giorno. Settimana. Mese. Quarto. Anno. In
FREE
Your swiss army knife to ancipate price reversals This indicator anticipates price reversals analyzing bullish and bearish pressure in the market. The buying pressure is the sum of all the accumulation bars over a certain number of days, multiplied by the volume. The selling pressure is the sum of all of the distribution over the same number of bars, multiplied by the volume. It gives you a measure of the buying pressure as a percentage of the total activity, which value should fluctuate from 0
Introducing the 'No Nonsense Reversal Megaprofits' indicator for MetaTrader 5 (MT5), your ultimate tool for identifying trend reversals with precision and confidence. This powerful indicator is designed to cut through the noise of the markets and pinpoint crucial turning points with ease. Powered by advanced algorithms, 'No Nonsense Reversal Megaprofits' analyzes price action and key market dynamics to accurately detect when a trend is about to reverse. Whether you're a novice trader or a season
KT DMA is a modified and advanced version of the classic Displaced Moving Averages with buy/sell crossover alerts and a Multi-Timeframe scanner that shows DMA's direction across each real-time time frame. A Displaced Moving Average is a simple moving average that moves ahead or backward in a time frame (either short-term or long-term). It also allows you to predict price movement more accurately. Features Depicts the trend direction using the alignment of three moving averages. Buy/Sell signals
Introduction to Fractal Pattern Scanner Fractal Indicator refers to the technical indicator that makes use of the fractal geometry found in the financial market. Fractal Pattern Scanner is the advanced Fractal Indicator that brings the latest trading technology after the extensive research and development work in the fractal geometry in the financial market. The most important feature in Fractal Pattern Scanner is the ability to measure the turning point probability as well as the trend probabil
VWAP Cloud
Flavio Javier Jarabeck
4.22 (9)
Do you love VWAP? So you will love the VWAP Cloud . What is it? Is your very well known VWAP indicator plus 3-levels of Standard Deviation plotted on your chart and totally configurable by you. This way you can have real Price Support and Resistance levels. To read more about this just search the web for "VWAP Bands" "VWAP and Standard Deviation". SETTINGS VWAP Timeframe: Hourly, Daily, Weekly or Monthly. VWAP calculation Type. The classical calculation is Typical: (H+L+C)/3 Averaging Period to
FREE
Volume Bands Chart
Rafael Caetano Pinto
This indicator marks the relevant volume levels among the day. The two relevant levels are the candle with more volume and the period with more volume of lots transacted.  The filled red background is the range of price with the most relevant volume of the day (probably the big player that is command the game). The purple lines shows the range of price with most volume (probably a area where some big player is accumulating before force a market direction). There is also the dot lines that marks
To get access to MT4 version please click   here . This is the exact conversion from TradingView: QQE MT4 Glaz-modified by JustUncleL This is a light-load processing and non-repaint indicator. All input options are available. This is not a multi time frame indicator. Buffers are available for processing in EAs. You can message in private chat for further changes you need.
Indicator introduction:  A channel and trend line indicator, which is a good tool for manual trading, and also can be used for creating new EAs, without drifting or repainting.  It applies to any timeframes and any symbols.   The work of the indicator is shown in the screenshots. For any novice and programming trading friend, you can write the signal into the EA to play freely, buffer 0 corresponds to the bold trend line, buffer 4 and 5 respectively corresponds to the channel's upper and lower f
This Indicator adding power to traditional zigzag indicator. With High-Low numbers in vision it will be easier to estimate change of trend by knowing the depth of each wave. Information including points, pips, percentage%, and #bars can be displayed based on configuration. All information is real-time update. This indicator is especially useful in sideway market to buy low sell high.
Rush Point Histogram Continuity force indicator. Operation: After a breach of support or resistance of an asset, the trader can understand by reading the histogram if such a move tends to continue, thus filtering false breaks or short breaks without trend formation. Through a simple, level-based reading, the trader can make a decision based on the histogram, where: Below 21: No trend formation 21 to 34: Weak trend 34 to 55: Strong Trend 55 to 89: Strong tendency Suggested Reading: Observed disru
Индикатор Magneto Weekly Pro отображает: Недельные важные линии поддержки и сопротивления (выделены желтым, красным и синим цветами). Основные недельные цели (выделены белым цветом). Недельные паттерны возврата цены (обозначаются красными флажками). Применение индикатора Magneto Pro можно использовать и как дополнение к существующей стратегии, и как самодостаточную торговую стратегию. Данный продукт состоит из двух индикаторов, работающих на разных временных промежутках, и предназначен для скал
Gli utenti di questo prodotto hanno anche acquistato
Trend Screener Pro MT5
STE S.S.COMPANY
4.89 (74)
Indicatore di tendenza, soluzione unica rivoluzionaria per il trading di tendenze e il filtraggio con tutte le importanti funzionalità di tendenza integrate in un unico strumento! È un indicatore multi-timeframe e multi-valuta al 100% non ridipingibile che può essere utilizzato su tutti i simboli/strumenti: forex, materie prime, criptovalute, indici e azioni. Trend Screener è un indicatore di tendenza che segue un indicatore efficiente che fornisce segnali di tendenza a freccia con punti nel gra
Golden Trend Indicator MT5
Noha Mohamed Fathy Younes Badr
4.87 (15)
Golden Trend indicator  is The best indicator for predicting trend movement this indicator never lags and never repaints and never back paints    and give  arrow buy and sell    before the candle appear  and it will help you and  will make your trading decisions clearer its work on all currencies and  gold and crypto and all time frame This unique  indicator uses very secret algorithms to catch the  trends, so you can trade using this indicator and see the trend clear on charts  manual guide and
FX Volume MT5
Daniel Stein
4.82 (17)
FX Volume: Scopri il Vero Sentimento di Mercato dalla Prospettiva di un Broker Panoramica Rapida Vuoi portare la tua strategia di trading a un livello superiore? FX Volume ti offre informazioni in tempo reale su come i trader retail e i broker sono posizionati—molto prima che compaiano report in ritardo come il COT. Che tu miri a guadagni costanti o desideri semplicemente un vantaggio più solido sui mercati, FX Volume ti aiuta a individuare grandi squilibri, confermare i breakout e perfezionar
FX Levels MT5
Daniel Stein
5 (3)
FX Levels: Supporti e Resistenze di Precisione Eccezionale per Tutti i Mercati Panoramica Rapida Cercate un modo affidabile per individuare livelli di supporto e resistenza in ogni mercato—coppie di valute, indici, azioni o materie prime? FX Levels fonde il metodo tradizionale “Lighthouse” con un approccio dinamico all’avanguardia, offrendo una precisione quasi universale. Basato sulla nostra esperienza reale con i broker e su aggiornamenti automatici giornalieri più quelli in tempo reale, FX
FX Power MT5 NG
Daniel Stein
5 (11)
FX Power: Analizza la Forza delle Valute per Decisioni di Trading Più Intelligenti Panoramica FX Power è lo strumento essenziale per comprendere la reale forza delle principali valute e dell'oro in qualsiasi condizione di mercato. Identificando le valute forti da comprare e quelle deboli da vendere, FX Power semplifica le decisioni di trading e rivela opportunità ad alta probabilità. Che tu segua le tendenze o anticipi inversioni utilizzando valori estremi di Delta, questo strumento si adatta
CBT Quantum Maverick Sistema di Trading Binario ad Alta Efficienza CBT Quantum Maverick è un sistema di trading binario ad alte prestazioni progettato per trader che cercano precisione, semplicità e disciplina. Non è necessaria alcuna personalizzazione: il sistema è ottimizzato per fornire risultati efficaci fin dall'inizio. Con un po' di pratica, i segnali possono essere facilmente compresi. Caratteristiche principali: Precisione dei Segnali: Segnali di trading basati sulla candela attuale,
IX Power MT5
Daniel Stein
4.83 (6)
IX Power: Scopri approfondimenti di mercato per indici, materie prime, criptovalute e forex Panoramica IX Power è uno strumento versatile progettato per analizzare la forza di indici, materie prime, criptovalute e simboli forex. Mentre FX Power offre la massima precisione per le coppie di valute utilizzando i dati di tutte le coppie disponibili, IX Power si concentra esclusivamente sui dati di mercato del simbolo sottostante. Questo rende IX Power una scelta eccellente per mercati non correlat
Top indicator for MT5   providing accurate signals to enter a trade without repainting! It can be applied to any financial assets:   forex, cryptocurrencies, metals, stocks, indices .  Watch  the video  (6:22) with an example of processing only one signal that paid off the indicator! MT4 version is here It will provide pretty accurate trading signals and tell you when it's best to open a trade and close it. Most traders improve their trading results during the first trading week with the help of
Quantum TrendPulse
Bogdan Ion Puscasu
5 (13)
Ecco   Quantum TrendPulse   , lo strumento di trading definitivo che combina la potenza di   SuperTrend   ,   RSI   e   Stocastico   in un unico indicatore completo per massimizzare il tuo potenziale di trading. Progettato per i trader che cercano precisione ed efficienza, questo indicatore ti aiuta a identificare con sicurezza le tendenze di mercato, i cambiamenti di momentum e i punti di entrata e uscita ottimali. Caratteristiche principali: Integrazione SuperTrend:   segui facilmente l'andame
FX Dynamic: Monitora volatilità e trend con un’analisi ATR personalizzabile Panoramica FX Dynamic è uno strumento potente che sfrutta i calcoli di Average True Range (ATR) per fornire ai trader informazioni impareggiabili sulla volatilità, sia giornaliera che intraday. Impostando soglie di volatilità chiare—ad esempio 80%, 100%, 130%—puoi individuare rapidamente opportunità di profitto o ricevere avvisi quando il mercato supera i range abituali. FX Dynamic si adatta al fuso orario del tuo brok
TPSproTREND PrO MT5
Roman Podpora
4.69 (16)
TPSpro TREND PRO   è un indicatore di tendenza che analizza automaticamente il mercato, fornisce informazioni sulla tendenza e sui rispettivi cambiamenti e fornisce segnali per entrare nelle operazioni senza ridisegnare. L'indicatore utilizza ciascuna candela e la analizza separatamente. Si riferisce a vari shock al rialzo o al ribasso. Punto di ingresso preciso per il trading di valute, criptovalute, metalli, azioni e indici! Versione MT5                   Descrizione completa dell'indicatore  
TPSpro RFI Levels MT5
Roman Podpora
4.53 (19)
ISTRUZIONI       RUS   -   INGLESE       Si   consiglia di utilizzare con un indicatore       -       TPSpro   TENDENZA PRO -   Versione MT4         Un elemento chiave nel trading sono le zone o i livelli da cui vengono prese le decisioni di acquisto o vendita di uno strumento di trading. Nonostante i tentativi dei principali attori di nascondere la loro presenza sul mercato, lasciano inevitabilmente delle tracce. Il nostro compito era imparare a identificare queste tracce e interpretarle corre
Bill Williams Advanced
Siarhei Vashchylka
5 (9)
Bill Williams Advanced is designed for automatic chart analysis using Bill Williams' "Profitunity" system. The indicator analyzes four timeframes at once. Manual (Be sure to read before purchasing) Advantages 1. Automatically analyzes the chart using the "Profitunity" system of Bill Williams. The found signals are placed in a table in the corner of the screen. 2. Equipped with a trend filter based on the Alligator indicator. Most of the system signals are recommended to be used only according t
Questo cruscotto mostra gli ultimi   pattern armonici   disponibili per i simboli selezionati, in modo da risparmiare tempo ed essere più efficienti /   versione MT4 . Indicatore gratuito:   Basic Harmonic Pattern Colonne dell'indicatore Symbol :   vengono visualizzati i simboli selezionati Trend:   rialzista o ribassista Pattern:   tipo di pattern (gartley, butterfly, bat, crab, shark, cypher o ABCD) Entry:   prezzo di ingresso SL:   prezzo di stop loss TP1:   1 prezzo di take profit TP2:
Matrix Arrow Indicator MT5
Juvenille Emperor Limited
5 (13)
Matrix Arrow Indicator MT5   è un trend unico 10 in 1 che segue un indicatore multi-timeframe al   100% non ridipinto   che può essere utilizzato su tutti i simboli/strumenti:   forex ,   materie prime ,   criptovalute ,   indici ,   azioni .  Matrix Arrow Indicator MT5  determinerà la tendenza attuale nelle sue fasi iniziali, raccogliendo informazioni e dati da un massimo di 10 indicatori standard, che sono: Indice di movimento direzionale medio (ADX) Indice del canale delle materie prime (CCI
Gartley Hunter Multi
Siarhei Vashchylka
5 (9)
Gartley Hunter Multi - An indicator for searching for harmonic patterns simultaneously on dozens of trading instruments and on all possible timeframes. Manual (Be sure to read before purchasing) | Version for MT4 Advantages 1. Patterns: Gartley, Butterfly, Shark, Crab. Bat, Alternate Bat, Deep Crab, Cypher 2. Simultaneous search for patterns on dozens of trading instruments and on all possible timeframes 3. Search for patterns of all possible sizes. From the smallest to the largest 4. All fou
Support And Resistance Screener è in un indicatore di livello per MetaTrader che fornisce più strumenti all'interno di un indicatore. Gli strumenti disponibili sono: 1. Screener della struttura del mercato. 2. Zona di ritiro rialzista. 3. Zona di ritiro ribassista. 4. Punti pivot giornalieri 5. Punti pivot settimanali 6. Punti pivot mensili 7. Forte supporto e resistenza basati sul modello e sul volume armonici. 8. Zone a livello di banca. OFFERTA A TEMPO LIMITATO: il supporto HV e l'indicatore
Presentazione       Quantum Breakout PRO   , l'innovativo indicatore MQL5 che sta trasformando il modo in cui scambi le zone di breakout! Sviluppato da un team di trader esperti con un'esperienza di trading di oltre 13 anni,       Quantum Breakout PRO       è progettato per spingere il tuo viaggio di trading a nuovi livelli con la sua strategia innovativa e dinamica della zona di breakout. Quantum Breakout Indicator ti fornirà frecce di segnalazione sulle zone di breakout con 5 zone target di
Innanzitutto, vale la pena sottolineare che questo Strumento di Trading è un Indicatore Non-Ridipingente, Non-Ridisegnante e Non-Laggante, il che lo rende ideale per il trading professionale. Corso online, manuale utente e demo. L'Indicatore Smart Price Action Concepts è uno strumento molto potente sia per i nuovi che per i trader esperti. Racchiude più di 20 utili indicatori in uno solo, combinando idee di trading avanzate come l'Analisi del Trader del Circolo Interno e le Strategie di Tradin
RelicusRoad Pro MT5
Relicus LLC
4.78 (18)
Ora $ 147 (aumentando a $ 499 dopo alcuni aggiornamenti) - account illimitati (PC o MAC) Manuale utente di RelicusRoad + Video di formazione + Accesso al gruppo Discord privato + Stato VIP UN NUOVO MODO DI GUARDARE IL MERCATO RelicusRoad è l'indicatore di trading più potente al mondo per forex, futures, criptovalute, azioni e indici, fornendo ai trader tutte le informazioni e gli strumenti di cui hanno bisogno per rimanere redditizi. Forniamo analisi tecniche e piani di trading per aiutare og
FxaccurateLS
Shiv Raj Kumawat
WHY IS OUR FXACCCURATE LS MT5 THE PROFITABLE ? PROTECT YOUR CAPITAL WITH RISK MANAGEMENT Gives entry, stop and target levels from time to time. It finds Trading opportunities by analyzing what the price is doing during established trends. POWERFUL INDICATOR FOR A RELIABLE STRATEGIES We have made these indicators with a lot of years of hard work. It is made at a very advanced level. Established trends provide dozens of trading opportunities, but most trend indicators completely ignore them! The
TW Trend Scalper Indicator: The TW Scalper Shoot ti offre un'esperienza di trading unica utilizzando le ultime strategie di trading e la tecnologia dell'intelligenza artificiale. Questo prodotto soddisfa le diverse esigenze dei trader scalper fornendo due categorie distinte di segnali: Testa questo prodotto eccezionale oggi e inizia la tua esperienza unica per diventare un scalper di tendenze. Inoltre, ricevi un prodotto del valore di 37 $ come regalo. Categorie di segnali: 1. Segnali a lu
L'indicatore Quadrato di Gann è uno strumento potente di analisi di mercato basato sull'articolo "Formula Matematica per le Previsioni di Mercato" scritto da W.D. Gann. Questo strumento utilizza concetti matematici e teorie di Gann per effettuare un'analisi precisa del mercato. Utilizza i quadrati di 144, 90, 52 e anche il quadrato di 9. Inoltre, integra il metodo del  per il quadrato di 9 e la sua relazione con canali e modelli stellari di quel quadrato. Manuale Utente e Applicazione: Prima di
Easy Breakout MT5
Mohamed Hassan
5 (3)
After your purchase, feel free to contact me for more details on how to receive a bonus indicator called VFI, which pairs perfectly with Easy Breakout for enhanced confluence!     Easy Breakout MT5   is a powerful price action trading system built on one of the most popular and widely trusted strategies among traders: the   Breakout strategy ! This indicator delivers crystal-clear Buy and Sell signals based on breakouts from key support and resistance zones. Unlike typical breakout indicators
BookMap HeatMap
Roberto Spadim
1 (2)
This Indicator creates a heatmap based on depth of market of the current symbol or another symbol. Other symbol is useful when you trade futures market and a contract has 'mini' and 'full' split. For example, in Brazil (B3 - BMF&Bovespa), WDO and DOL are future Forex contract of BRL/USD (where 1 DOL = 5 WDO) and big banks work mostly with DOL (where liquidity is important). Please use with M1 timeframe , objects are too small to be displayed at higher timeframes (MT5 limit). The number of level
Berma Bands
Muhammad Elbermawi
5 (3)
L'indicatore Berma Bands (BBs) è uno strumento prezioso per i trader che cercano di identificare e capitalizzare i trend di mercato. Analizzando la relazione tra il prezzo e le BBs, i trader possono discernere se un mercato è in una fase di trend o di range. Visita il [ Berma Home Blog ] per saperne di più. Le Berma Bands sono composte da tre linee distinte: la Upper Berma Band, la Middle Berma Band e la Lower Berma Band. Queste linee sono tracciate attorno al prezzo, creando una rappresentazion
Royal Scalping Indicator M5
Vahidreza Heidar Gholami
5 (6)
Royal Scalping Indicator is an advanced price adaptive indicator designed to generate high-quality trading signals. Built-in multi-timeframe and multi-currency capabilities make it even more powerful to have configurations based on different symbols and timeframes. This indicator is perfect for scalp trades as well as swing trades. Royal Scalping is not just an indicator, but a trading strategy itself. Features Price Adaptive Trend Detector Algorithm Multi-Timeframe and Multi-Currency Trend Low
ICT, SMC, SMART MONEY CONCEPTS, SMART MONEY, Smart Money Concept, Support and Resistance, Trend Analysis, Price Action, Market Structure, Order Blocks, BOS/CHoCH,   Breaker Blocks ,  Momentum Shift,   Supply&Demand Zone/Order Blocks , Strong Imbalance,   HH/LL/HL/LH,    Fair Value Gap, FVG,  Premium  &   Discount   Zones, Fibonacci Retracement, OTE, Buy Side Liquidity, Sell Side Liquidity, BSL/SSL Taken, Equal Highs & Lows, MTF Dashboard, Multiple Time Frame, BigBar, HTF OB, HTF Market Structure
Volumatic VIDyA MT5
Duc Hoan Nguyen
5 (1)
Special offer : ALL TOOLS , just $35 each! New tools   will be   $30   for the   first week   or the   first 3 purchases !  Trading Tools Channel on MQL5 : Join my MQL5 channel to update the latest news from me Volumatic VIDYA (Variable Index Dynamic Average) è un indicatore avanzato progettato per monitorare le tendenze e analizzare la pressione di acquisto e vendita in ogni fase di una tendenza. Utilizzando il Variable Index Dynamic Average come tecnica principale di smorzamento dinamico, que
- Lifetime update free -   Real price is 80$   - 25% Discount ( It is 59$ now ) Contact me for instruction, any questions! Related Product:  Gold Trade Expert MT5 - Non-repaint - I just sell my products in Elif Kaya Profile, any other websites are stolen old versions, So no any new updates or support. Introduction The breakout and retest strategy is traded support and resistance levels. it involves price breaking through a previous level.  The break and retest strategy is designed to help trade
Filtro:
Nessuna recensione
Rispondi alla recensione