Fibonacci Volatility Indicator MT5
- Indicatori
- Young Ho Seo
- Versione: 6.8
- Aggiornato: 30 luglio 2020
- Attivazioni: 5
Introduction to Fibonacci Volatility Indicator
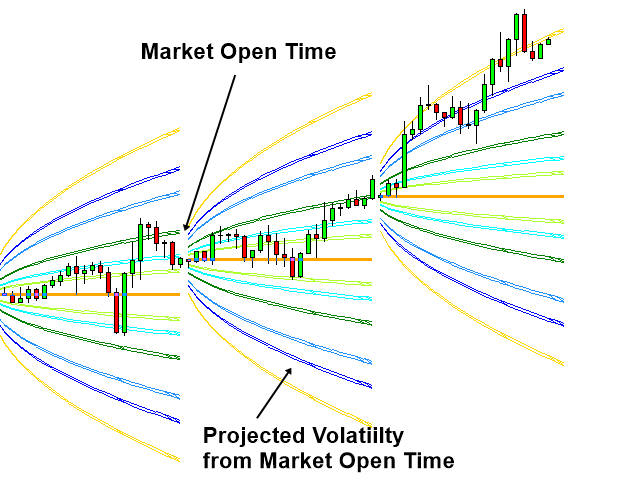
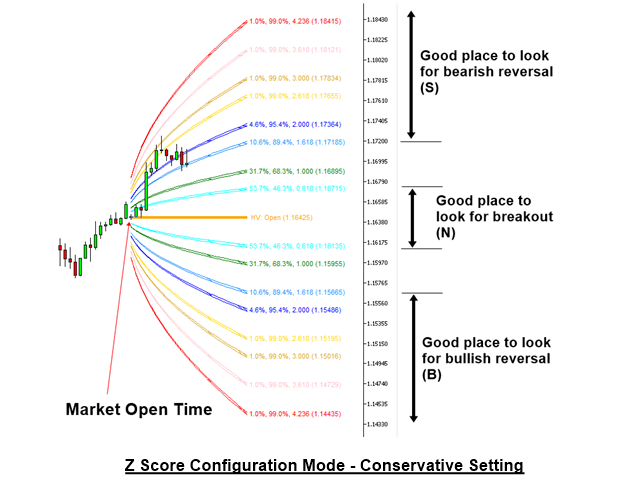
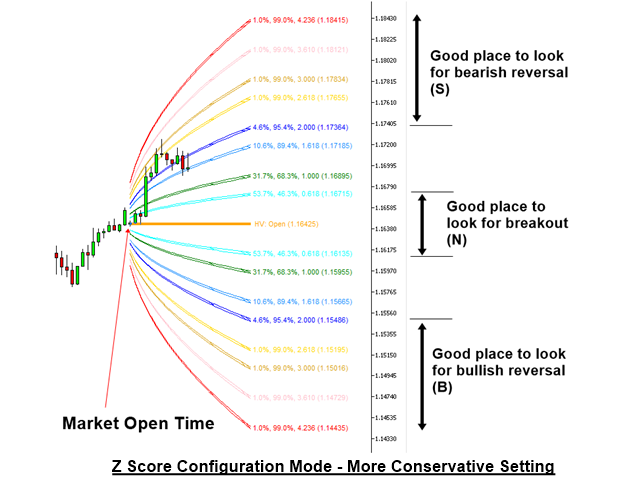
Volatility indicator can help you to detect any statistical advantage for your trading. Especially, if you are trading with Price Action and Price Patterns, then we recommend to use the Volatility indicator together with your strategy. Especically, Fibonacci Volatility indicator combines the market volatiltiy with Fibonacci Analysis to provide you more advanced volatiltiy indicator.
Main Features
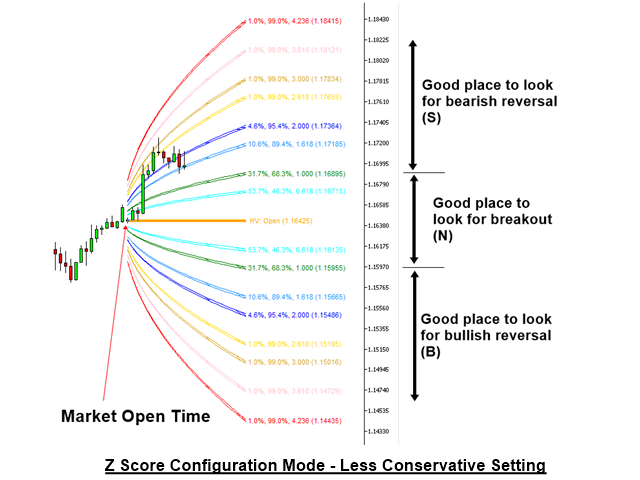
- Fibonacci Volatility in Z score Configuration Mode
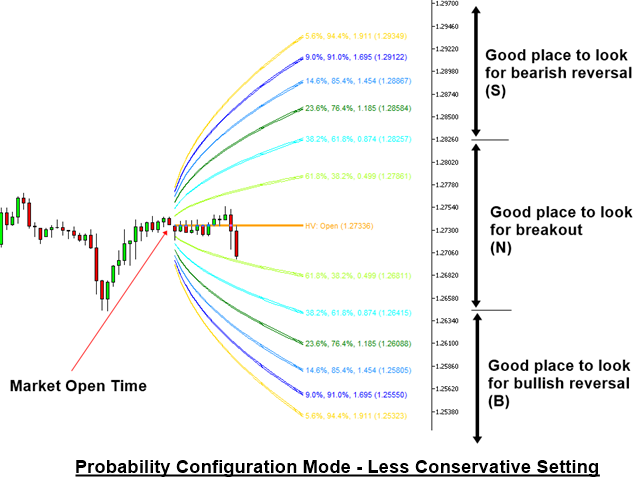
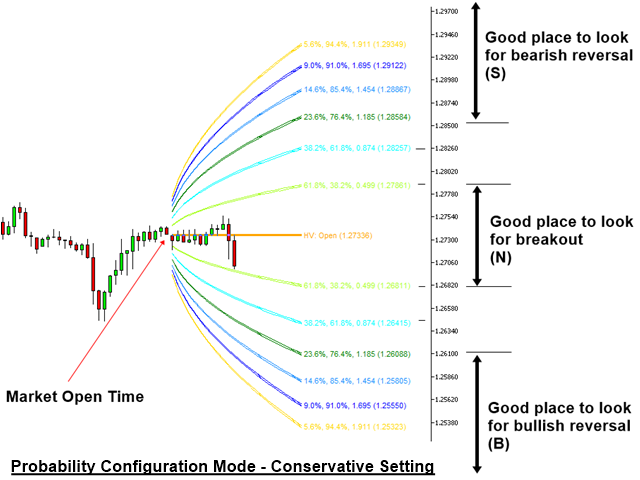
- Fibonacci Volatility in Probability Configuration Mode
- Daily, Weekly, Monthly, and Yearly Volatility Mode
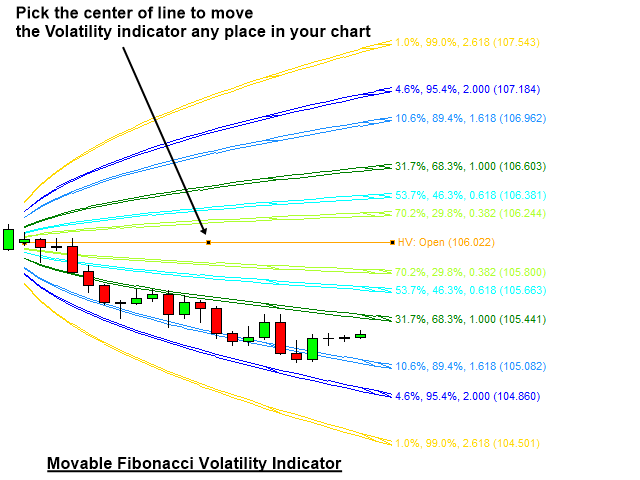
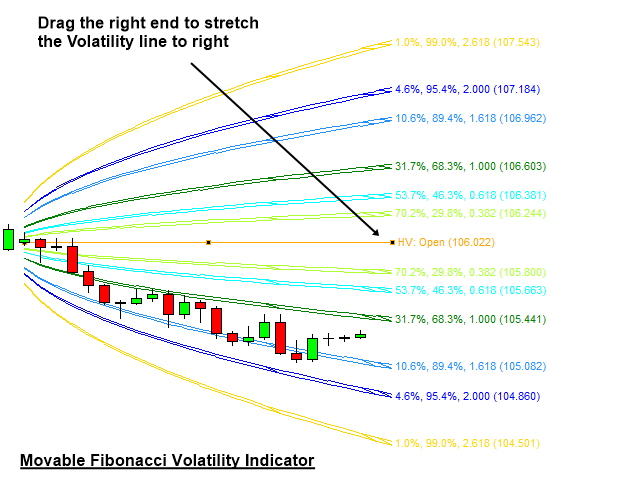
- Movable Volatility – Useful for geometric pattern analysis
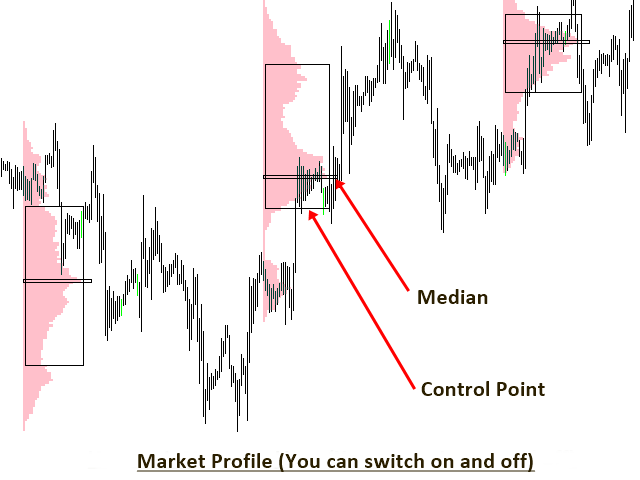
- Market Profile Analysis
- Support and Resistance using Volatility projection
- Alert for Low Volatile Area
- Alert for High Volatile Area
Trading Strategy Guide
You can find the detaild trading strategy guide about how to use volatility indicator from the link below. We highly recommend to read this article before using this volatiltiy indicator for your trading.
https://www.mql5.com/en/blogs/post/750389
Settings
To use Z score configuration mode, set "Use Z Score Configuration" = true. If you set "Use Z Score Configuration" = false, then indicator will use Probability Configuration Mode. Probability Configuration Mode is the same as Harmonic Volatility Indicator. These inputs below control the global setting of the indicator.
- Number of Daily Session: 0 means indicator will not draw any daily volatility lines. 1 means that indicator will draw one set of daily volatility lines. You can create multiple session of daily volatility lines. However, too many sessions can slow down your MetaTrader. So use the right number for your computer.
- Number of Weekly Session: It is the same as daily session input.
- Number of Monthly Session: It is the same as daily session input.
- Starting Index: 0 is default value. For 0, indicator will start to draw from session 0.
- Use White Chart: True means that you will use white background chart.
- Use Individual Line Color: If false, then you will use global color scheme. If true, then you can use individual color scheme
- Daily Line Color: Color of daily line
- Weekly Line Color: Color of weekly line
- Monthly Line Color: Color of monthly line
- Show Probability Lines: Switch on and off the curved probability line
- Show Final Projection: Switch on and off the trading zone box
- Final Projection Margin: Size of box
Input Settings for Each Probability Line
Each probability line can be switched on and off according to your preferences. You have the same setting for nine lines.
- Use Line 1: You can switch on and off the line
- Probability of Line 1: this input is only active when you set the indicator for Probability Configuration Mode
- Z Score of Line 1: this input is only active when you set the indicator for Z Score Configuration Mode
- Probability Line 1 Color: Color for line
- Probability Line 1 Width: Width for line
- Probability Line 1 Style: Style for line
Keyboard Short Cut
Press Keyboard D: Redraw Volatility indicator from your chart.
Timeframe Choice
When Daily Market Profile session is on, you cannot use H4, D1, W1 and MN timeframe
Important Note
This is the off the shelf product. Therefore, we do not accept any modification or customization request on this product. In addition, we do not provide any code library or any support for your coding for this product.






This Fibo Volatility is really a hidden gem, try it and you know how accurate price reacted to the zone, Author is reaally a Genius very talented developer and very helpful responsive to customer query and supportive with video tutorial, best buy for 2023!