This is a combination of indices
- Indicatori
- Hao Zhi Chen
- Versione: 1.0
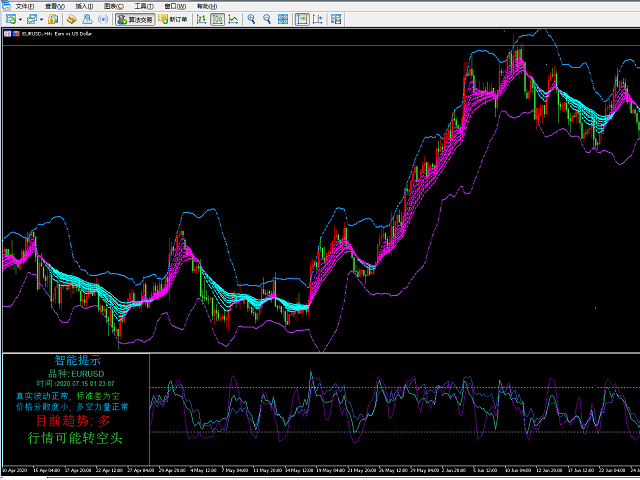
这是一个组合指标分析趋势、支撑阻力、买卖点。运用了均线MA、布林带、KDJ、CCI、RSI。
主图上下线是布林带上下线,采用的是20周期和2.3标准差可以用来支撑阻力。
中间的是分析趋势的均线,趋势分析是用均线多周期:
为涨趋势,反之为下跌趋势。在同一种颜色,基本说明趋势没有发生变化。
子图是由 KDJ、CCI、RSI三个指标组成,大于70超买,小于30超卖,
智能提示是运用了算法,主要计算布林带, KDJ、CCI、RSI指标
有三个或四个指标超出市场常态就会发出提示行情可能反转。
子图指标运用了很多数据,刚刚开始加载会有点慢,耐心等待就可以
这个指标是主图指标,还要再下我发布的RCD分析,这样就刚刚好组成一套分析
电脑分辨率的文本大小请设置100%,不然字体会不一样


It is very kind for the author to develop this free EA software. I have a chance to install it and test it. From the short period, it looks very helpful for me to observe the trend. I need more time to understand the more functions and I believe I could obtain more profits in future.