Relative Strength Ratio RSR
- Indicatori
- Eduardo Fernando Teixeira
- Versione: 1.3
- Attivazioni: 5
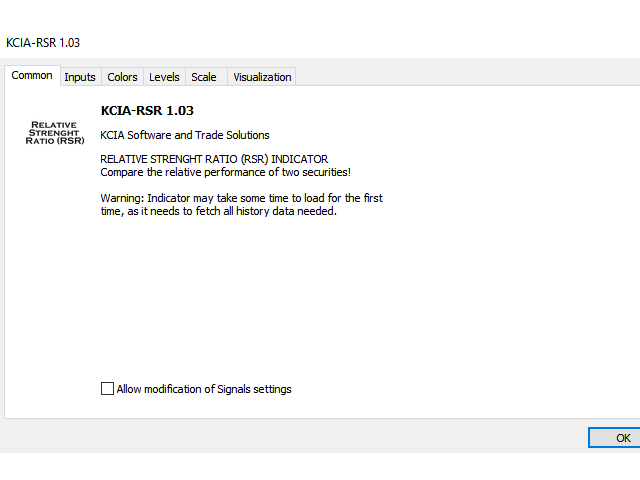
Relative Strength Ratio (RSR)
The Relative Strength Ratio (RSR) indicator compares the performance of one security against another, dividing the base security by the comparative security, and showing the ratio of this division in a line chart. This indicator is also known as the Relative Strength indicator, Price Relative, or Relative Strength Comparative.
It is one of the main tools for Intermarket Analysis professionals, to help them identify Sector Rotations and other global relationships between equities, indexes, bonds, currencies, commodities, etc.
The Relative Strength Ratio (RSR) can also be used to gauge the relative performance of a stock against a benchmark index, such as the S&P 500 or any international stock exchange index. Analysts can also use the RSR to compare the relative performance of a stock to its sector or industry group. This makes it possible to determine if a stock is leading or lagging its peers. The Relative Strength Ratio (RSR) indicator can also be used to find stocks that are holding up better during a broad market decline or showing weakness during a broad market advance.
Attention! Relative Strength (RSR) and Relative Strength Index (RSI) are two completely different things! The Relative Strength Index is an indicator that only uses information from its own symbol to make its calculations, that oscillate between 0 and 100, while the Relative Strength Ratio (RSR) makes calculations with data from two securities, as mentioned above.
Portfolio and fund managers compare their performance to a benchmark, such as the S&P 500. Their goal is to outperform that benchmark, and in order to achieve this goal, they often look for stocks that have good Relative Strength. The indicator line RISES when a security shows relative strength, therefore it's OUTPERFORMING the benchmark. Conversely, the line FALLS when a security loses strength and therefore is UNDERPERFORMING the benchmark.
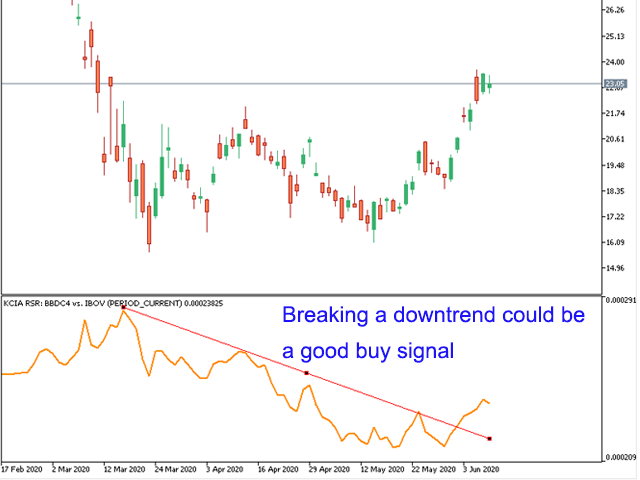
Chartists can perform simple trend analysis to determine the direction of the RSR. This can be done drawing trend lines, support/resistance breaks, adding the Moving Average indicator on it, etc. They can also look for bullish and bearish divergences to warn of potential reversals.
You can make a comparison between any two tickers that Metatrader can load in the broker you are connected to, as long as there is liquidity in them. You can compare a stock against another stock, a stock against an index, a currency against an ETF, bonds against commodities’s futures, you name it!
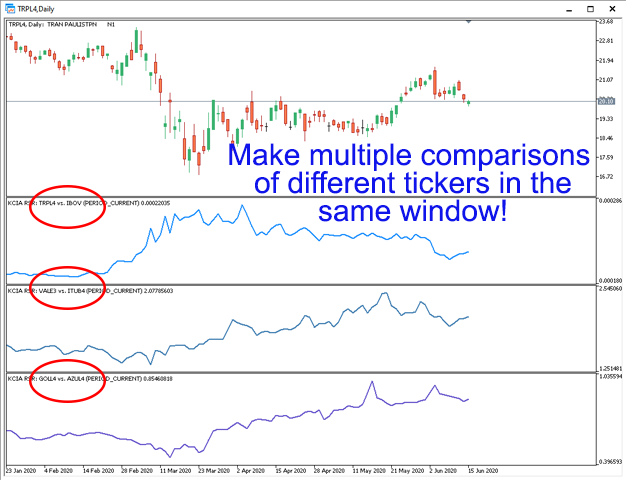
One interesting feature in this indicator is that you can load it several times in the same window, showing different comparisons amongst different securities at the same time. (See screenshots).
Watchout for intraday time frames in the beginning of a session, as the instruments to be compared might have different trading start hours and the indicator will compare bars of different times (eg. first bar of the day compared to the last bar of last session).
Further Information on Relative Strength:
The Relative Strength Ratio (RSR) is also the basis for the Relative Rotation Analysis and the construction of Julius de Kempenaer’s Relative Rotation Graphics (RRG), in which the Relative Strength Ratio (RSR) raw data is used for the calculation of the JdK RS-Ratio and JdK RS-Momentum values that are then plotted in his cartesian chart.
John Murphy's Technical Analysis of the Financial Markets covers relative strength analysis in the chapter on intermarket analysis. Murphy also looks at sector relative strength and shows how to apply relative strength to individual stocks.
Martin Pring's Technical Analysis Explained features a chapter on the concept of relative strength. Pring shows chart examples to determine relative strength and also teaches readers how to combine relative strength with other indicators.
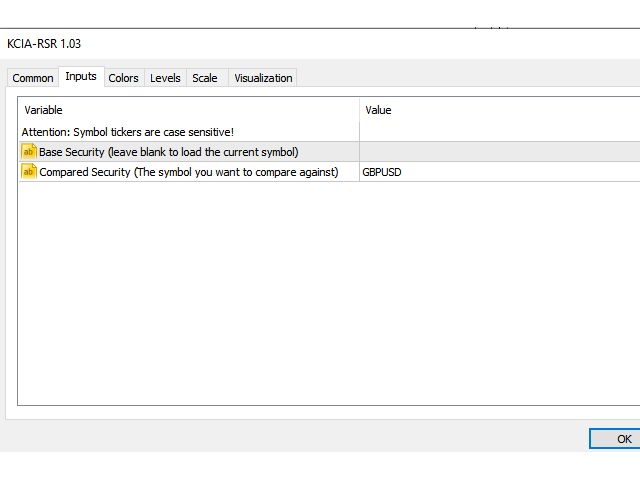
INPUT PARAMETERS:
| Base Security | The instrument symbol you want to compare the relative strength. By default it is the one loaded in the current window and will automatically update if you change it. Or you can enter a custom symbol. |
| Compared Security | Your benchmark, the security you want to compare. Normally an index but it can be any symbol. |


Love this indicator. Also, very good support.