Diamond indicator Media Movel
- Indicatori
- Sergio Vidal Prado
- Versione: 1.0
Media Móvel Grátis para uso em conjunto ao Diamond Indicator
Atenção. Essa é a mm para conjugar ao indicador.
Esse não é o indicador.
Comprem o indicador que está tendo ótimos resultados.
A seguir informações sobre o indicador:
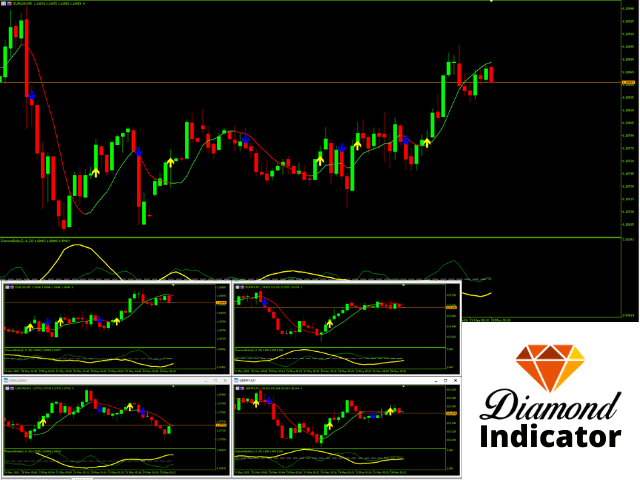
Indicador Para Opções Binarias.
Usa dois gales.
Instalar em mt5
Esse indicador é para ser usado no tempo de vela de 5 minutos e em M5.
Este também funciona em M1, porém é mais eficiente em M5.
Só descompactar e copiar os arquivos na pasta de dados do seu MT5.
Arquivos indicator na pasta MQL5 - Indicator.
Abra ou atualize o MT5, Carregue a carta do gráfico e arraste os seguintes arquivos:
- Diamond Signal.
Me solicite por email que envio também o Media Móvel e o RSI - Diamond Lag
- Diamond Index.
Esse Indicador é para a próxima vela.
Apareceu a seta, só aguardar a próxima vela e entrar com a ordem.
Diamond Indicator.
L'utente non ha lasciato alcun commento sulla valutazione.