DYJ AtrTrendReversal
- Indicatori
- Daying Cao
- Versione: 3.3
- Aggiornato: 20 settembre 2023
- Attivazioni: 5
L'inversione di tendenza DYJ di solito raggiunge un valore elevato sul fondo del mercato dopo che una vendita di panico ha causato un forte calo del prezzo.
I valori bassi dell'indicatore si verificano solitamente in cima alla grande scala e durante la fase laterale di lungo periodo di consolidamento.
DYJ AtrTrendReversal può essere interpretato secondo gli stessi principi di altri indicatori di volatilità.
Il principio di previsione basato sull'indicatore può essere formulato come segue: maggiore è il valore dell'indicatore,
maggiore è la probabilità di cambiamento di tendenza; Più basso è il valore dell'indicatore, più debole è il movimento della tendenza.
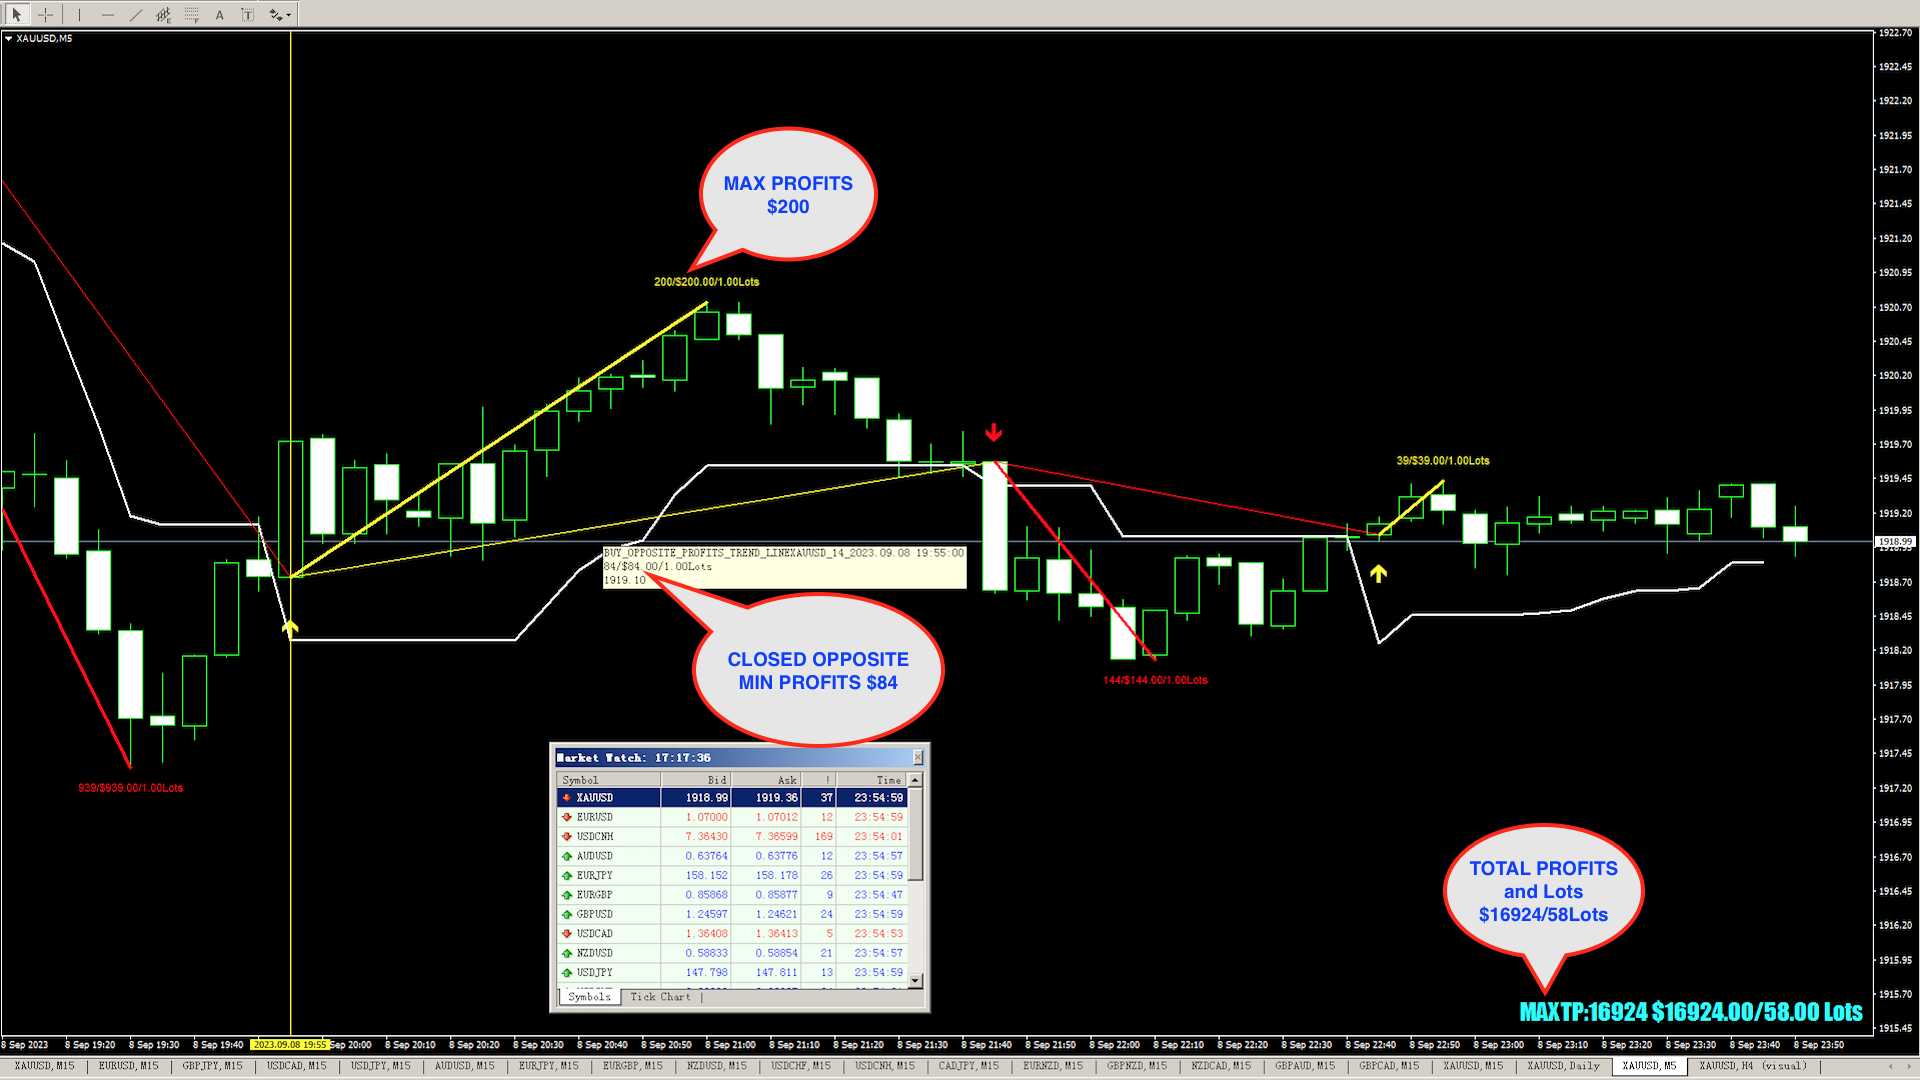
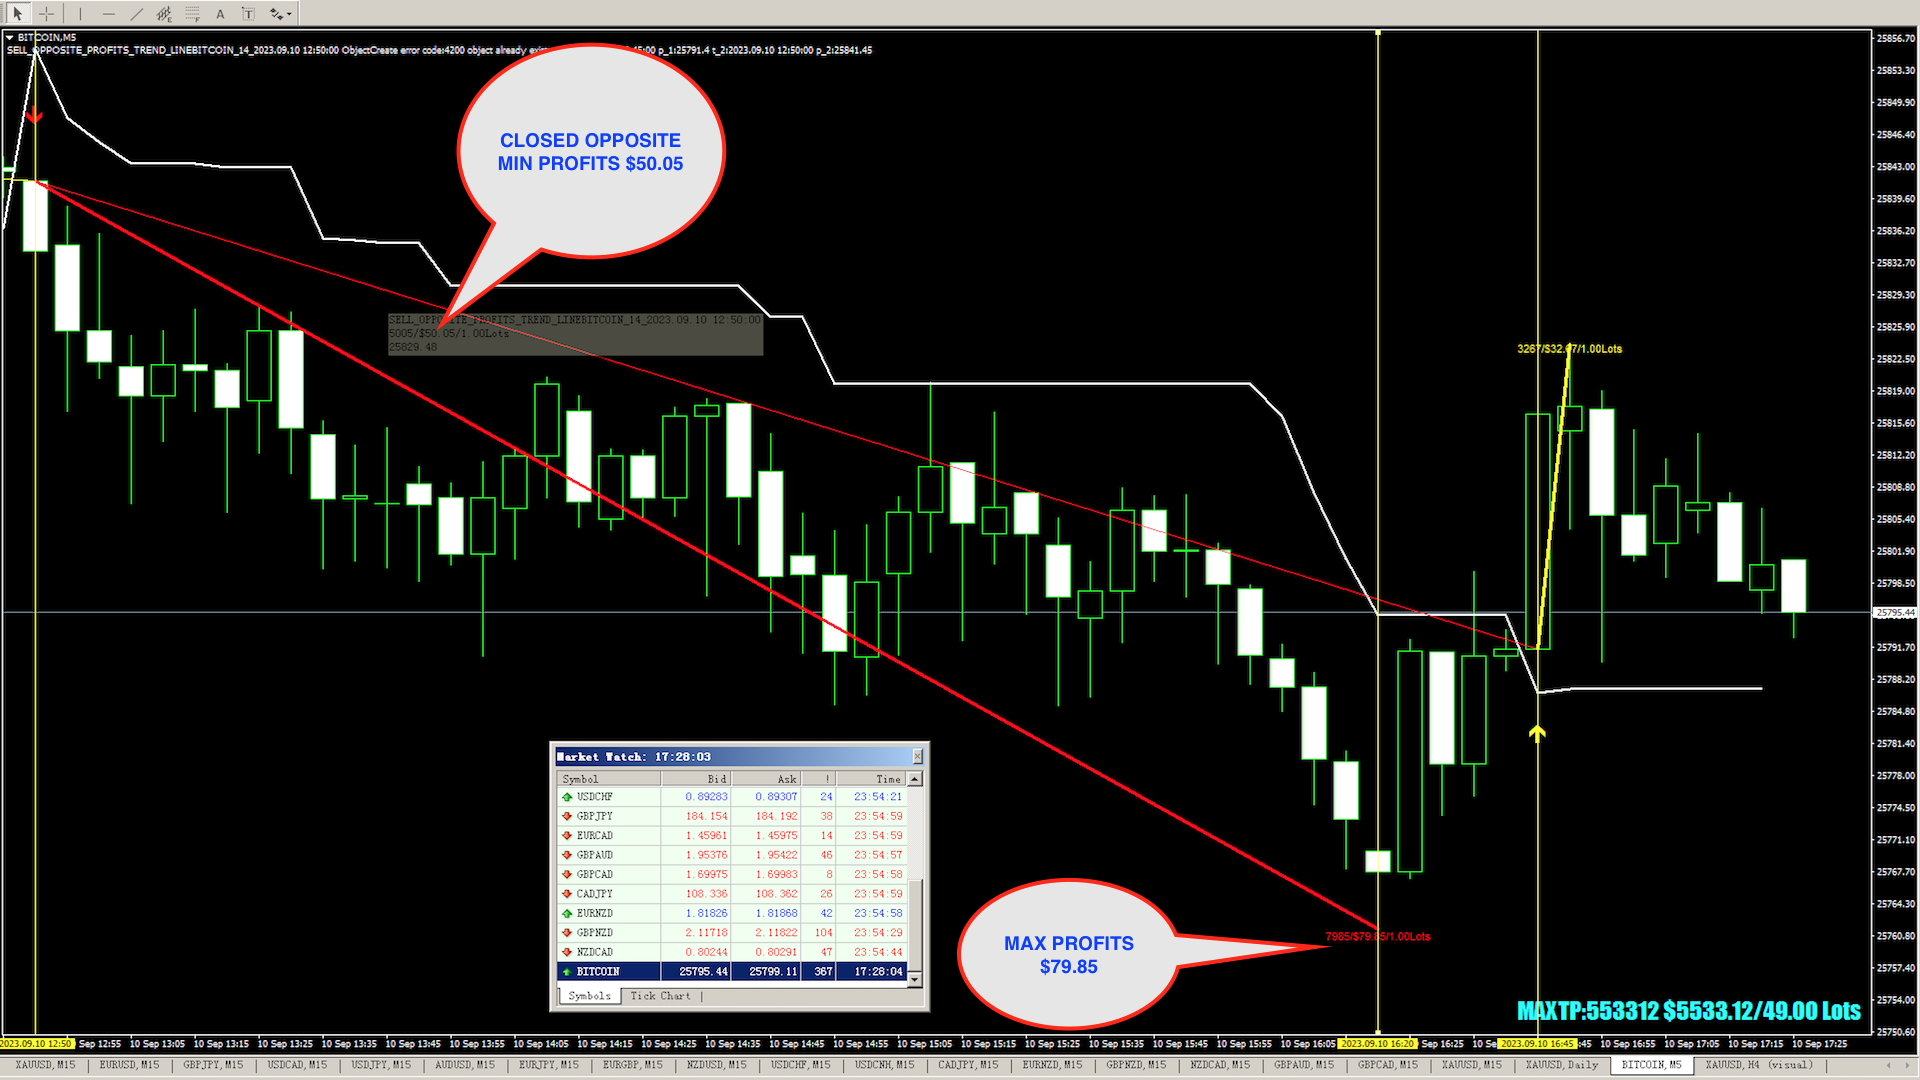
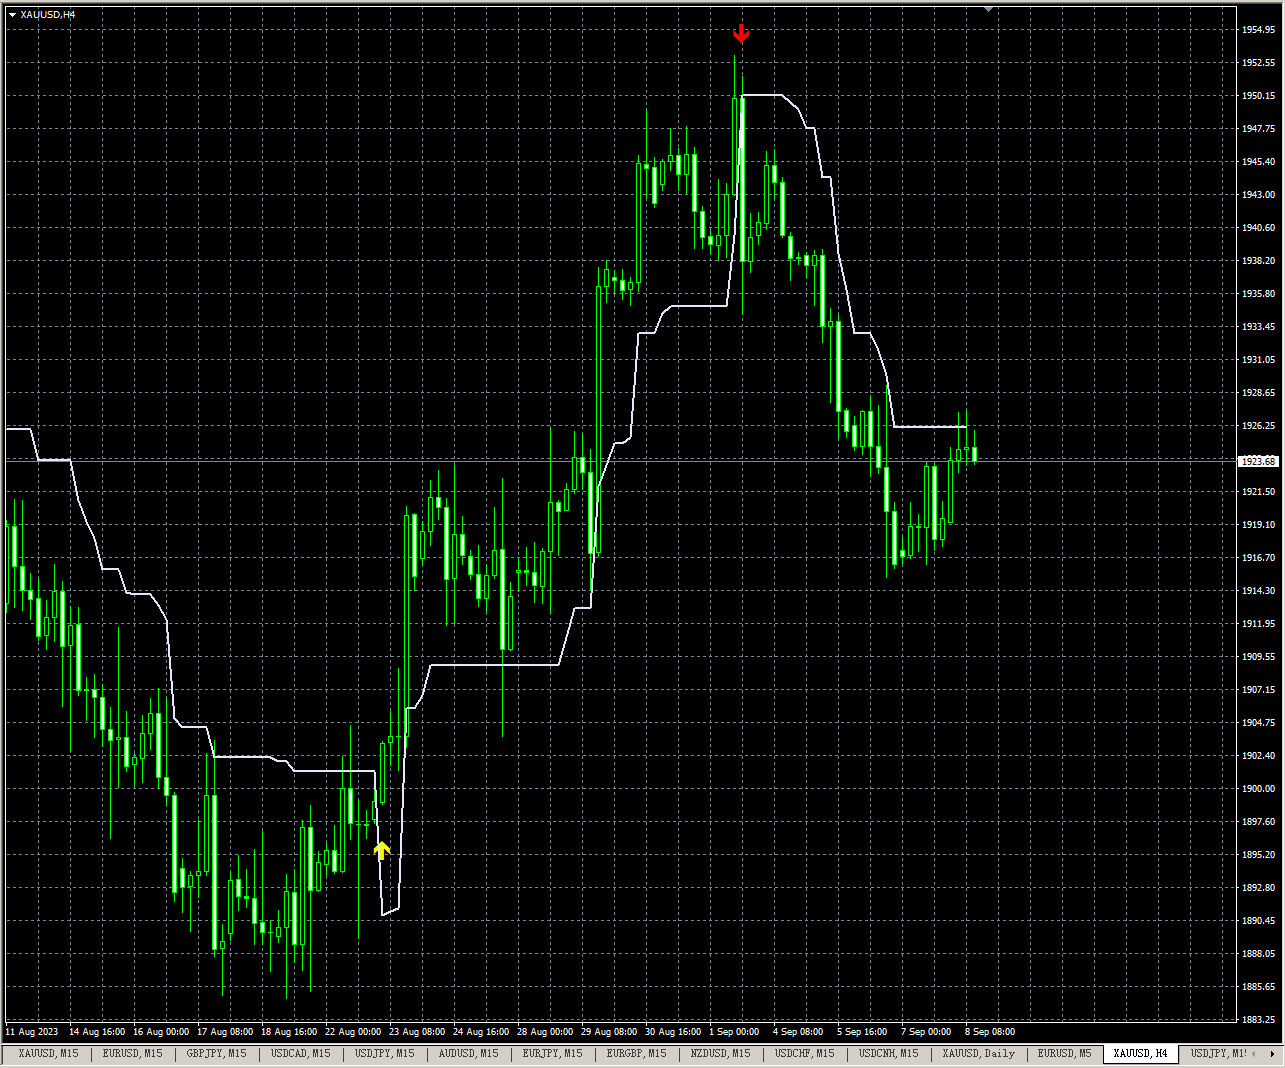
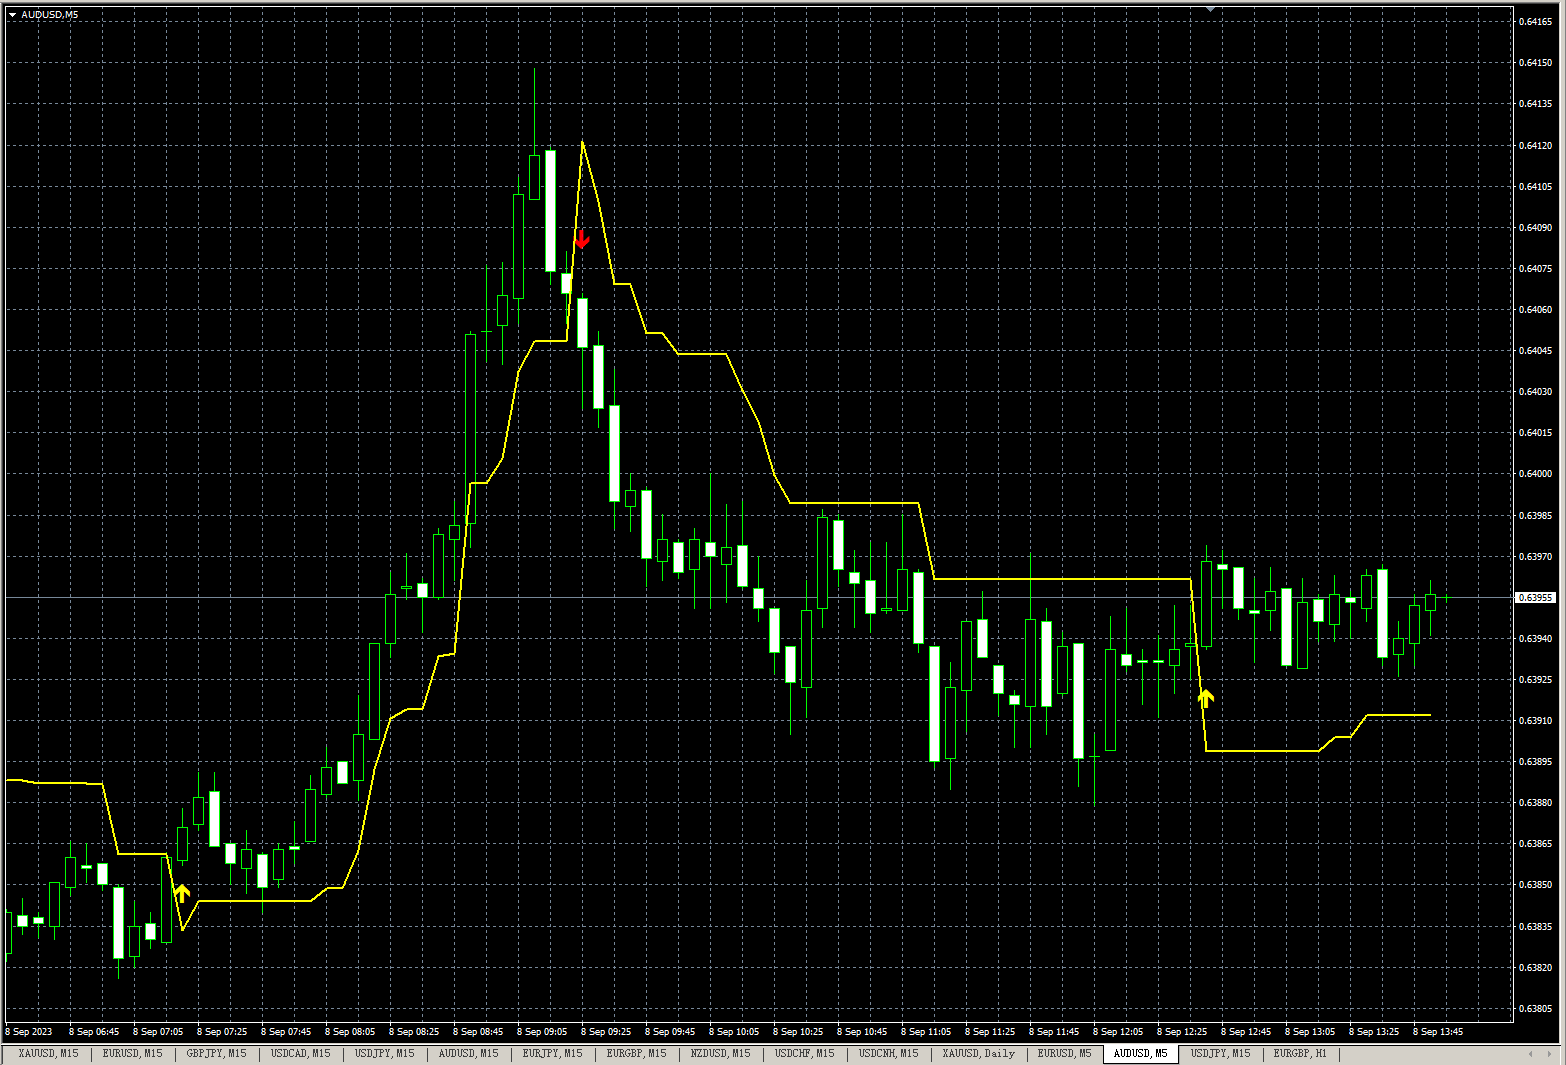
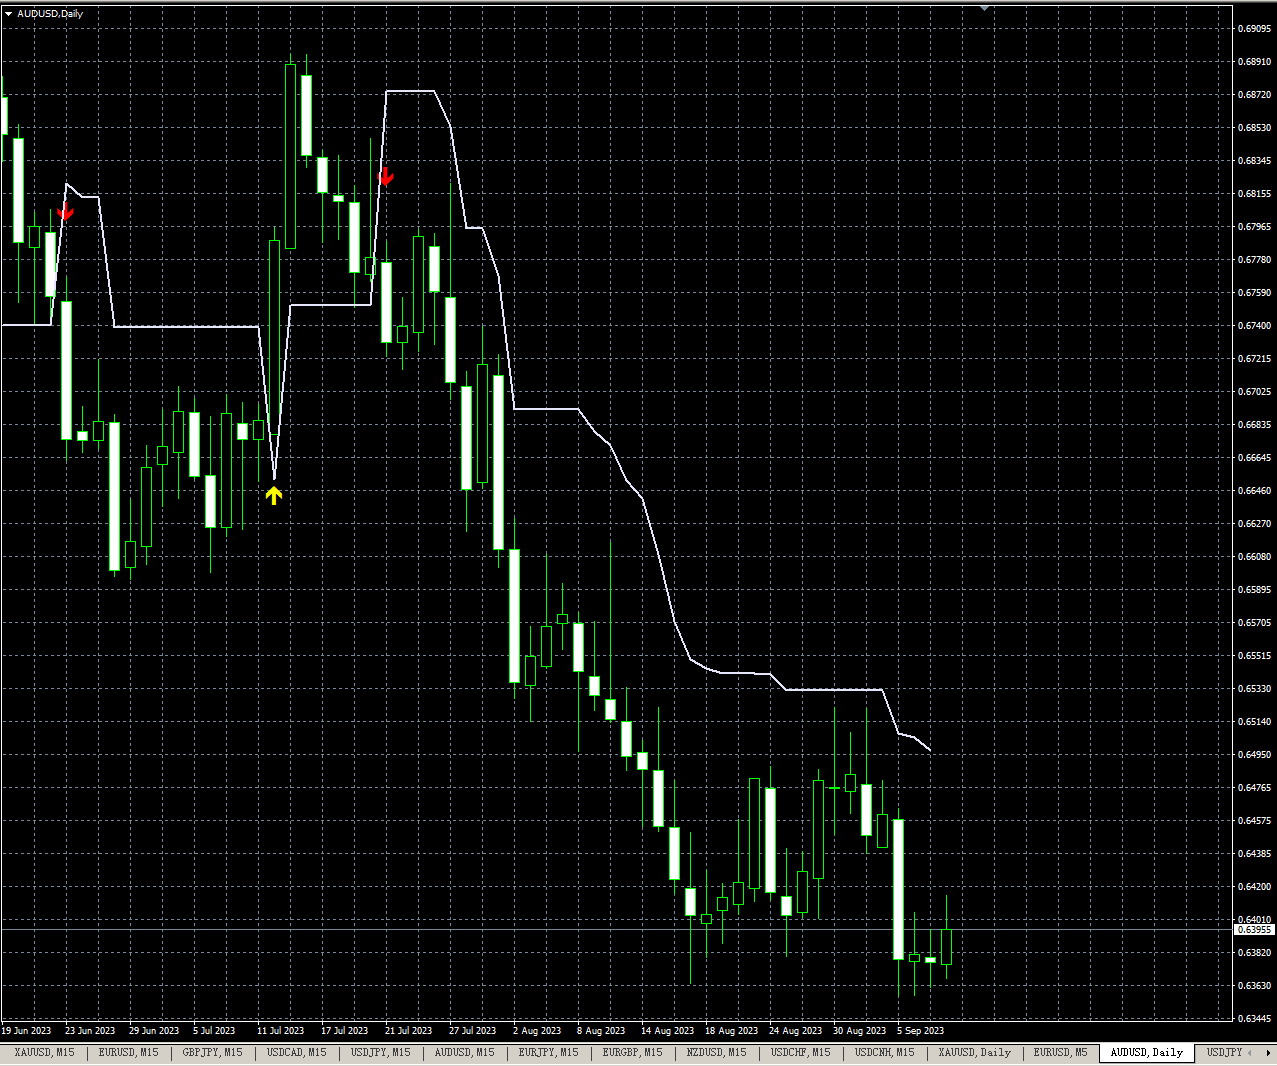
L'indicatore mostra la linea di tendenza ATR.
L'indicatore può mostrare una freccia sulla candela corrente, che consente di aprire immediatamente la posizione.
Visualizza la linea di tendenza del massimo profitto.
Visualizza la linea di tendenza chiusa opposta.
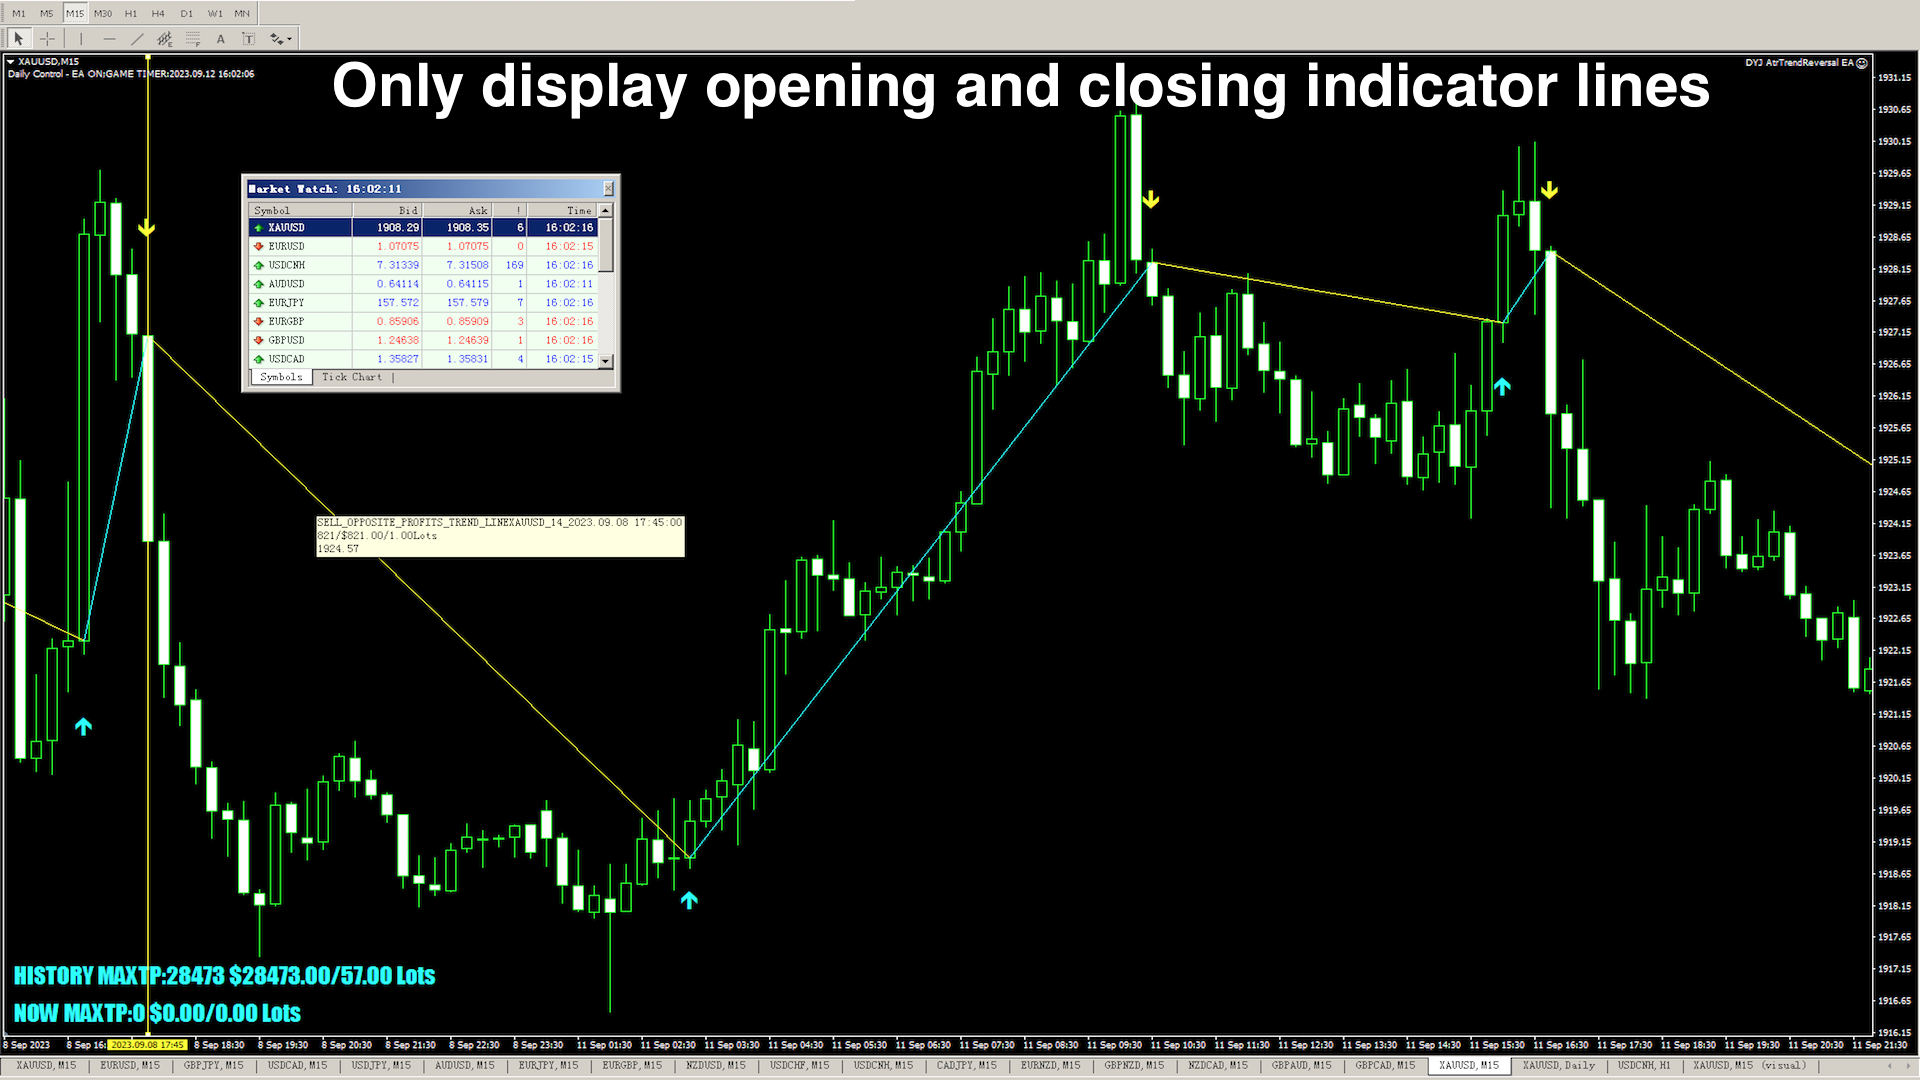
L'indicatore può anche mostrare solo la connessione dei punti di apertura e chiusura,
Hai una visione più chiara dell'ingresso e dell'uscita
Visualizza il profitto complessivo statistico.
Input
- InpLossKeyValue = 2 -- Key value for Loss
- ATRPeriods = 14 -- ATR periods
- InpSimulatedVolume = 1
- InpIsUseMaxTPStatistics = true
- InpTotalProfitsLabelObjCorner = CORNER_RIGHT_LOWER;
- InpStatisticsStartDate = 0
- notifications = false -- Notifications On?
- desktop_notifications = true -- Desktop MT4 Notifications
- email_notifications = false -- Email Notifications
- push_notifications = false -- Push Mobile Notifications
- ArrowUpClr = clrLime -- Arrow Up Color
- ArrowDnClr = clrRed -- Arrow Down Color
Good indicator. Author offers great support and is open to suggestions.