Yesterdays High Low Scanner
- Indicatori
- Berkay Yildiz
- Versione: 1.0
- Attivazioni: 7
Features
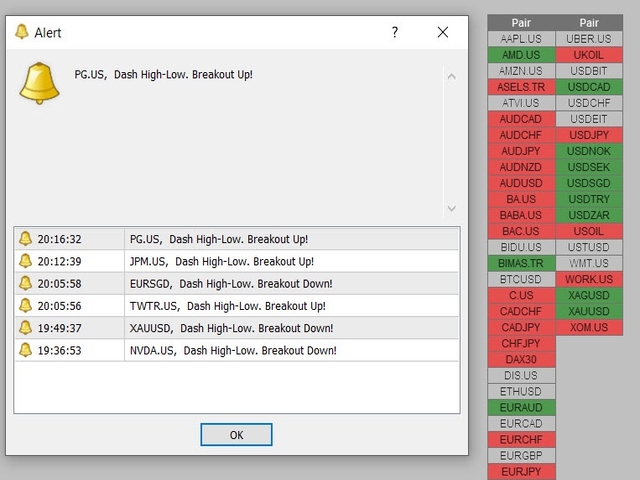
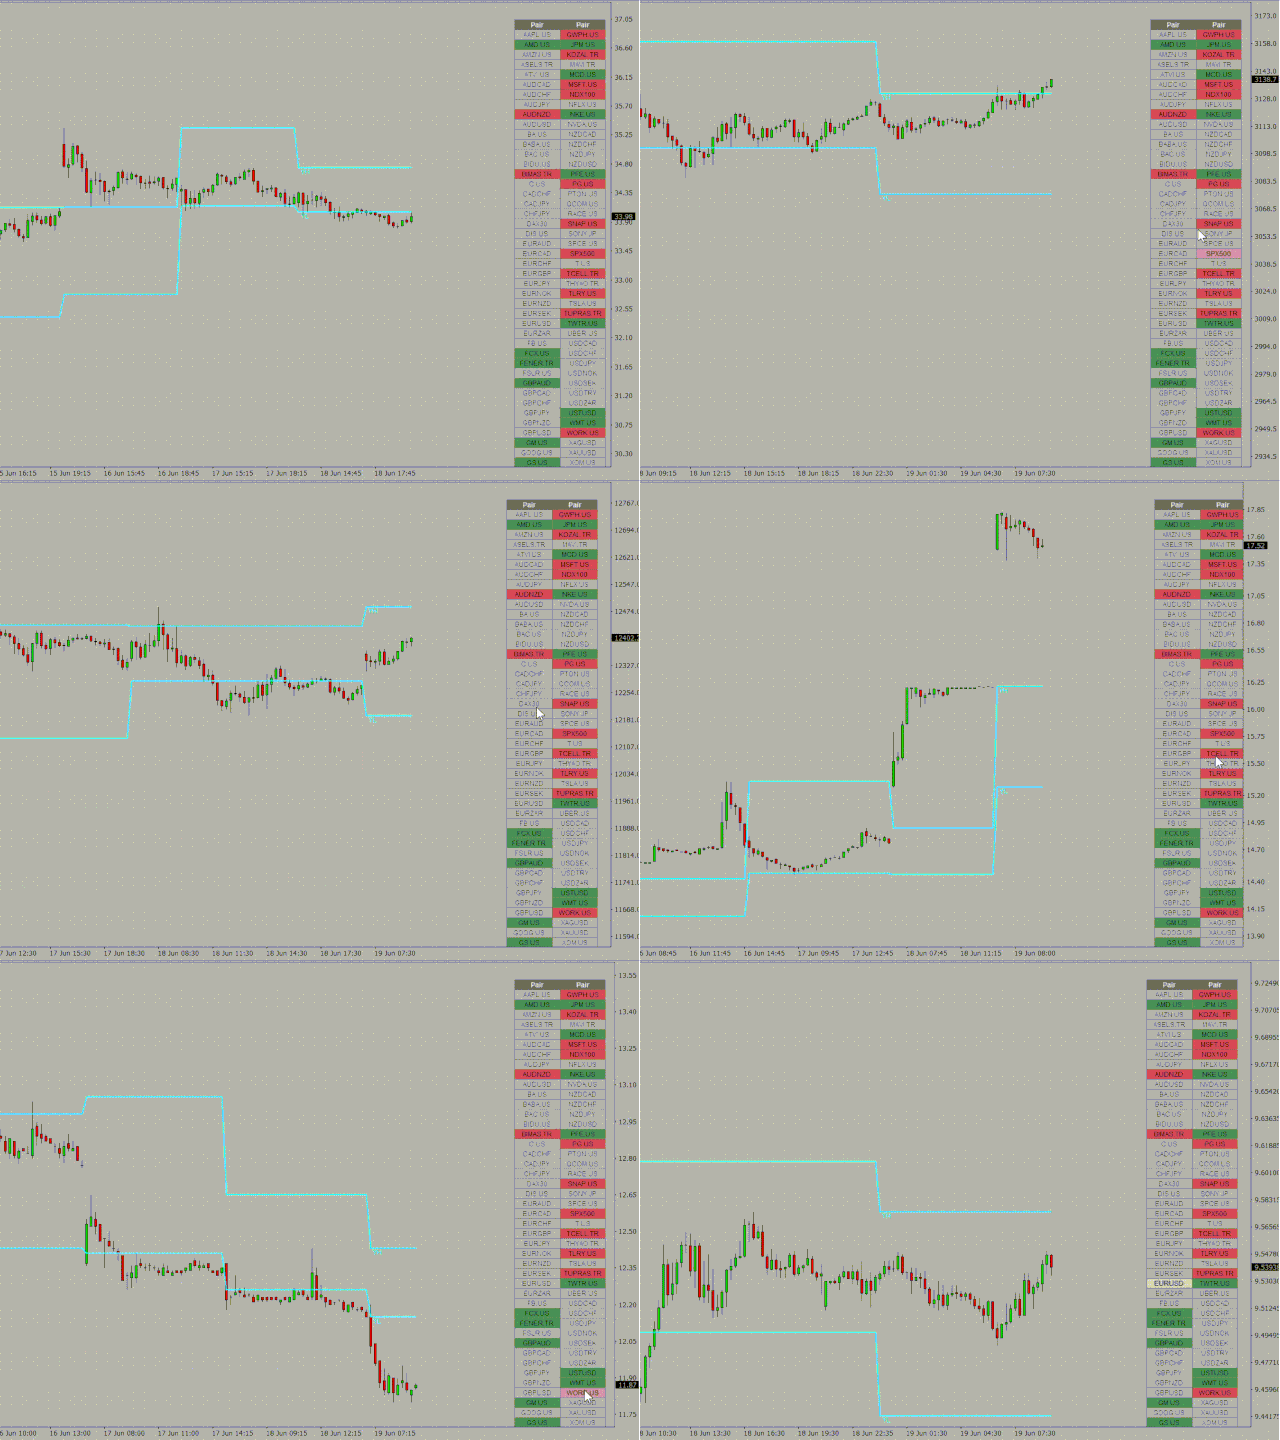
- With this scanner you can detect Candles which are below/above yesterday high/low lines. A pair's rectangle turns RED in dashboard if it is above the yesterday high, and rectangle turns GREEN in dashboard if it is below the yesterday low. It gives alerts in every 15m candle close.
- Contains a Dashboard which will help you to see all market pair's.
- It is possible to disable this sorting through to make it easier finding a specific symbol.
- By clicking inside a rectangle a new chart will be opened with the symbol and time frame.
- It is enough to place the indicator on one chart and you will receive an alert from any symbol of your choice.
- This scanner and dashboard do not show you yesterday high/low lines, you need to add it as a new indicator.
Input Parameters:
- High-Low Period: 1 Day
- Set of Pairs: Market Watch / Specified Manually
- Pairs: which you can add pair manually here.
- Sort Pairs: True = Yes, False = No
- Refresh Dashboard Every Second: Every X seconds, the indicator checks the candles if it close below/above yesterday high/low lines.
- Position of Chart: Right Top, Right Top, Left Bottom, Left Top, Centered.
- X offset and Y offset: Used for the shift Dashboard
- Open pairs in a new window: By clicking inside a rectangle a new chart will be opened.
- Color up: Color for filling the rectangles which have closed candle above the yesterday high.
- Color stop: Color for filling the rectangles which have no closed candle between the yesterday high and yesterday low.
- Color down: Color for filling the rectangles which have closed candle above the yesterday low.
- Transparency(0-255): Used for the Dashboard.
- Font name: Used for the symbol and time frame texts.
- Font size: Used for the symbol and time frame texts.
- Pop up alerts: True = Yes, False = No - if true, then the indicator gives alerts via MetaTrader 5 popup
- E-Mail Notifications: True = Yes, False = No - if true, then the indicator gives alerts via email
- Push Notifications: True = Yes, False = No - if true, then the indicator gives alerts direct to your mobile phone
- Sound Alerts: True = Yes, False = No









One of most useful indicator I used that fits right into my trading strategy. Please convert it to MT5. I would be happy to purchase it as well!