Liquidity Levels
- Indicatori
- Filip Maurice Daelman
- Versione: 10.0
- Aggiornato: 22 luglio 2020
- Attivazioni: 5
Dear Traders, check out my new multi level market liquidity indicator : https://www.mql5.com/en/market/product/73098
Many of you have been trading very good with this indicator, thanks for the support and positive feedbacks !
For more information about market liquidity, a manual on how to use this indicator please send me a message.
A lot of information can be found on the net. (search liquidity trading/ inner circle trader)
https://www.youtube.com/watch?v=yUpDZCbNBRI
https://www.youtube.com/watch?v=2LIad2etmY8&t=2054s
https://www.youtube.com/watch?v=wGsUoTCSitY&t=1124s
https://www.youtube.com/watch?v=5SwYZkXpw0E
Liquidity is an important aspect in the market, especially for institutional investors, as they need lots of liquidity to enter or exit the market.
The smart money acts as a MARKET MAKER for the herd. In other words: The smart money is the counterpart of the overhang of long or short positions being held by the herd. If the herd is net short then the smart money is net long. If the herd is net long then the smart money is net short. This creates a conflict of interest between the smart money and the herd. And because of its overwhelming power, the smart money will always win!
This to explain how the smart money operate.
Therefore, institutional traders focus more on demand/supply metrics than to the traditional technical analysis tools and techniques.
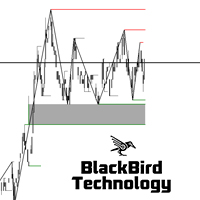
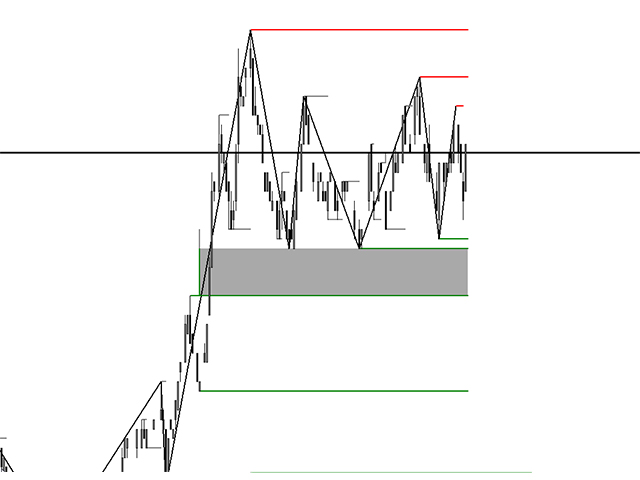
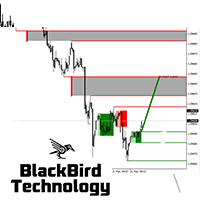
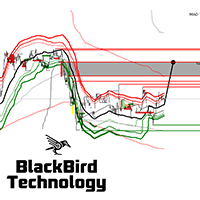
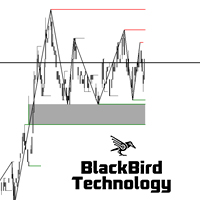
Next to the support and resistance levels, it indicates all major liquidity levels and pools in the market. The liquidity on these price levels is cumulated by stop loss, breakout, break-even orders of especially retail traders. The longer a support or resistance level holds, the more liquidity is cumulated just above/under this price level. This is also why systematically all stop loss orders are hit.
All these levels are sooner or later hit by prices action as institutional investors will drive the price to where the liquidity is.
By doing this manipulation, new liquidity zones are created that will again be crossed afterwards.
This indicator is not just yet another support and resistance indicator. Of course support and resistance levels are also liquidity levels as there is a cumulation of stop loss, breakout and break even orders. Levels that have been hit will stay on the chart as gray lines. This way you can see how these levels attract price action as a magnet.
The use of the indicator for traders :
- See the liquidity levels that will attract sooner or later the price
- Avoid taking long/short positions in the opposite direction of the liquidity pools
- If the price moves towards liquidity it is very likely that the liquidity zone will be crossed, partial or even completely, so use the indicator to put the take profit orders at the liquidity level
- A market reversal after a liquidity zone has been hit is very powerful, as the attraction of the current price level is gone.
There are not a lot of parameters for this indicator, but on request I am open for any suggestion or customization.
The indicator works on any instrument or any timeframe.
There is a demo version of this indicator available to use in Strategy tester.
You will immediately notice the use and the effectiveness of this indicator, watch the video (EURUSD-ECN forex pair).
Thanks for sharing, if you are happy please leave a positive review and a comment
Don't hesitate to contact me for support, issues or in case you are not happy.
IMPORTANT : Some calculations are based on the default Zig Zag indicator, which should be present in the root indicators folder.








Really good indicator!! Would be awesome to have some kind of manual to understand all the colors. Have been making good profits since using this indicator. Hope seller will respond on chat!