SOMFX1
- Indicatori
- Stanislav Korotky
- Versione: 1.1
- Aggiornato: 20 novembre 2021
- Attivazioni: 5
If you like trading by candle patterns and want to reinforce this approach by modern technologies, this indicator and other related tools are for you. In fact, this indicator is a part of a toolbox, that includes a neural network engine implementing Self-Organizing Map (SOM) for candle patterns recognition, prediction, and provides you with an option to explore input and resulting data. The toolbox contains:
- SOMFX1Builder - a script for training neural networks; it builds a file with generalized data about most characteristic price figures which can be used for next bars prediction either in a built-in sub-window (using this SOMFX1 indicator), or directly on the chart using SOMFX1Predictor;
- SOMFX1 - this indicator for price pattern prediction and visual analysis of a trained neural network, input and resulting data (in a separate sub-window);
- SOMFX1Predictor - another indicator for predicting price patterns just in the main window;
In brief, all the process of price analysis, network training, pattern recognition and prediction supposes the following steps:
- Build a neural network by SOMFX1Builder;
- Analyze the resulting neural network performance by means of SOMFX1; if not satisfied, repeat step 1 with new settings; you may skip this step if you wish;
- Use final neural network for price pattern prediction using SOMFX1Predictor.
All of these is covered in details below.
Introduction
What are candle patterns? They are distinctive figures formed by consecutive bars, which were "discovered" many years ago by traders' community and got funny names. There are no strong evidences that the patterns do work as expected - if not always, but at least in statistically significant majority of cases. Also it's not guaranteed that all the named patterns do cover all regularities of the modern market, especially taking into account that most of them were created in the era of old good comfortable markets. For example, if a chart would be shifted by a half bar period (say H4 moved by 2 hours), existing patterns would vanish and completely new patterns would be formed on other bars. Doesn't this mean that every conventional pattern should have several different representations? But wait, then the "hammer" wouldn't look like a hammer and the "star" wouldn't resemble a star? This seems breaking all artificial beauty of the candle pattern approach, but this is fair.
Patterns are just an easy to grasp visual representation of price changes, usually deltas between close prices of bars. These are not just candle patterns, but, generally speaking, price patterns.
And today we need, and most importantly we have an opportunity for a new scientific approach in price patterns recognition.
This indicator provides you with techology of neural networks, specifically Self-Orgranizing Map (SOM). As any other neural network, SOM consists of neurons - elementary calculation units. In SOM, every neuron can hold an information about a single price pattern. The reason why it is called SOM is that the network automatically compares different price patterns and places them on a 2-dimentional map, where neighbouring units (patterns) are similar to each other, and more distant units are less similar. Every price change can then be mapped to a best matching unit (BMU, see below), so, having a starting part of a pattern, it's possible to get the ending from the unit.
How it works
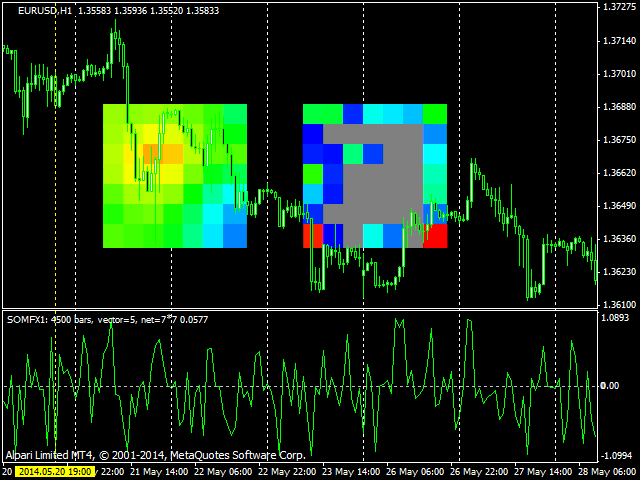
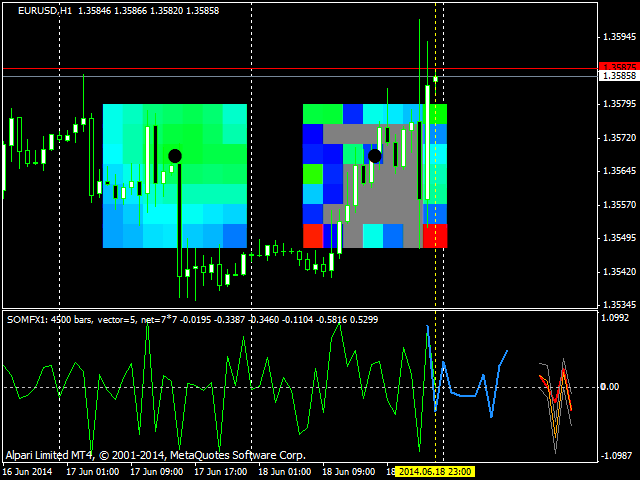
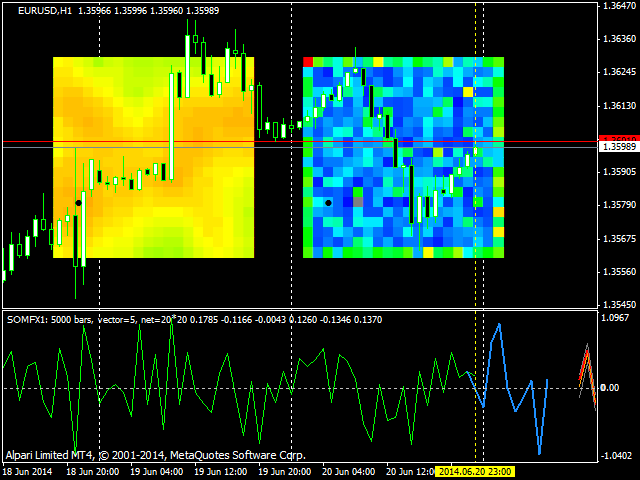
The indicator interface comprises of two parts. On the main chart, the map itself and auxiliary controls are displayed. In the sub-window price samples and predictions are shown. The samples and predictions are normalized (to [-1, +1] range) delta values between prices in consecutive bars. The samples form green line. The prediction is denoted by light-blue thick line (it has the length of PredictionBars bars and can continue in future). At the right side of patters (i.e. somewhere in future) you may see a bunch of lines of PatternSize bars length. They show a structure of currently selected best matching unit (find details below).
You need to train the network on some period of time in history (using SOMFX1Builder). This is a lengthy process but it can be - probably (why probably? - see below) - run only once. After the training you get the trained network, which can analyse and predict new price movements on the fly. Please consult with the SOMFX1Builder documentation for further details on network training.
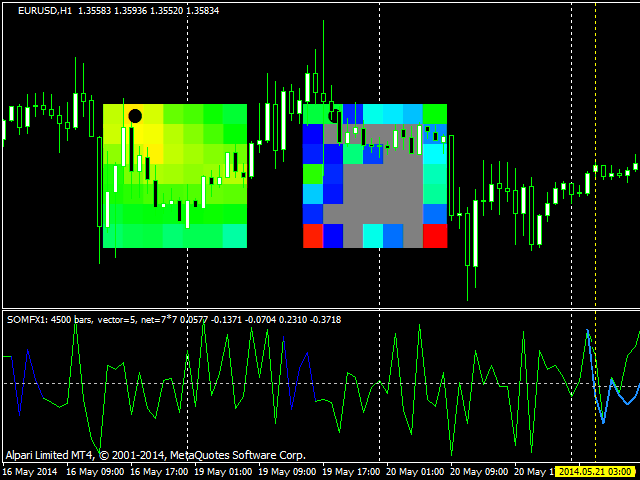
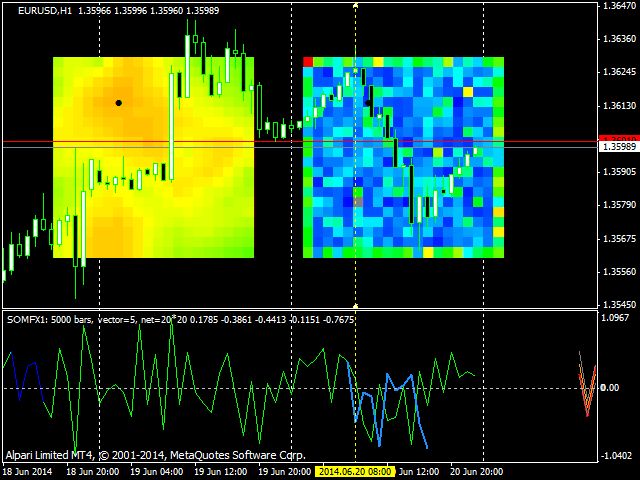
When the training is finished, you'll get a file with candlemap extension (SOMFX1Builder creates such files in the Files subdirectory of your MQL4 folder). You should specify the name of the file in the indicator settings, and the indicator will show 2 square maps on the main chart. The left square denotes current activity of every neuron: neurons with high excitation are shown in red, and neurons with high inhibition are shown in blue. In other words, the redder the cell on the map, the better it fits to current price sample. The current price sample is a fragment of delta values taken from PatternSize bars to the left of the vertical dotted yellow line named "FromPastToFuture". You can drag the line to an arbitrary position, and the indicator will read current sample at this position, and run SOM against this sample, so you'll see new activation of the map and prediction.
Please note, that the prediction starts at current bar, that is current bar is also predicted. This is done because current bar is usually unfinished and requires prediction as well. Moreover, if we could take currently unfinished bar into consideration, it will make prediction inconsistent (unstable during current bar lifetime). Due to the fact that current bar is predicted, light-blue thick line with prediction starts 1 bar left to the vertical line "FromPastToFuture" - it shows how price should change on the current bar.
The second - right-side - square map displays "population density" of every unit, that is its color denotes number of samples occured in the trainig data, which are landed to corresponding cell and formed corresponding price pattern. Again red color means relatively high population, and blue - relatively small. Gray cells do not have corresponding samples in training data.
When you move the line "FromPastToFuture" from bar to bar, the map chooses a unit which fits the price sample the best, and marks the winning unit with round dot. This unit is called best matching unit. Its weights are shown as red line in the right part of the sub-window. This is a specific price pattern automatically discovered and generalized by the network. If the unit has some samples mapped to it, an average price changes for all these samples are shown by orange line, and variance - in two gray lines above and below it.
This is exactly the information which makes prediction possible: when a new price changes fit beginning of some pattern (say, 4 bars of a 5-bars pattern), the ending of the pattern gives most probable continuation (the 5-th bar in the example).
When the line "FromPastToFuture" is moved, not only prediction and best matching unit structure are shown. In addition to this, indicator highlights price samples bound to the BMU in blue. This looks like blue fragments which partially overlay green curve with price deltas. Please bear in mind, that the samples may overlap each other. For example if pattern length is 4, and one sample starts at bar number 10, and another one starts at bar number 12, they will have 2 common bars. In such case, 6 consecutive bars will be highlighted in a row, and the samples are visually inseparable.
It's possible to drag a cell from the right-side square map to somewhere. When it happens indicator shows the price pattern and average values for this specific cell. (The cell itself will be moved back into the map automatically in the next moment.) This feature allows you to investigate patterns in the map.
Parameters
- LearnStart - number of a bar in history, or an exact date and time of the bar (in the format "YYYY.MM.DD HH:MM"), where training data began; this parameter is a string, whick allows you to enter either a number or a date; this parameter is used here not for training but for building actual price samples (corresponding to the network), which is important if UseAverage parameter is true (see below), as well as for map "population" visualization; default value - 5001; if you enter an automatically generated filename in NetFileName parameter (see below), the indicator parses the name and overrides this parameter by a value from the name; in other words, this parameter has no effect when an automatically generated filename is specified in NetFileName parameter;
- LearnStop - number of a bar in history, or an exact date and time of the bar (in the format "YYYY.MM.DD HH:MM"), where training data ended; this parameter is also a string; default value - 1; this parameter is used here not for training but for building actual price samples (corresponding to the network), which is important if UseAverage parameter is true, and for map "population" visualization; this parameter has no effect when an automatically generated filename is specified in NetFileName parameter;
- PatternSize - number of bars in a single pattern; default value - 5; this parameter has no effect when an automatically generated filename is specified in NetFileName parameter;
- GridSize - dimentions of the map; this is a number of cells/units on X and Y axes; allowed values: 3 - 50; default value - 7; this parameter has no effect when an automatically generated filename is specified in NetFileName parameter;
- PredictionBars - number of bars to predict; default value - 10; please note, that every next bar is predicted with less accuracy than previous, because unavoidable errors on every bar are accumulated;
- UseAverage - this is a special mode switch; when disabled (false, default value) predictions are made using weights of winning neurons, that is they are product of the map; when enabled (true), predictions are based on average values of all price samples mapped into winning neuron; this requires not only the map, but the training data as it was used for the network training, which is why it's important to specify exact date and time where sampling has been made during training; you may "play" with this parameter to obtain better results: using weight vectors is the conventional approach, but using averages adds more data awareness - for example, you can take into account a variance value for estimating prediction accuracy;
- PriceType - price type to use for sampling; default value - close; this parameter has no effect when an automatically generated filename is specified in NetFileName parameter;
- AddInvertedPrice - enable/disable a mode, when inverted price movements are added into the samples; default - true;
- NetFileName - a filename of the trained neural network generated by SOMFX1Builder script; if the name was generated automatically, it comprises several necessary components to restore most of abovementioned parameters, so a user may fill in only this one parameter; the filename structure is the following: SOM-V-D-SYMBOL-TF-YYYYMMDDHHMM-YYYYMMDDHHMM-P.candlemap, where V - PatternSize, D - GridSize, SYMBOL - current work symbol, TF - current timeframe, YYYYMMDDHHMM - LearnStart and LearnStop respectively; P - PriceType;
- CellSize - size of a single unit visualized on the chart; default value - 20, which is ok for maps with dimentions up to 10; for larger map choose smaller cell size, or otherwise the two map views will overlap;
- PrintData - enable/disable debug logging; default - false;
If some of parameters are incorrect, the indicator prints an error message into the log. For example, you can load a map only on a chart with the same symbol and timeframe that was used during training.
