• Panoramica
  • Recensioni (128)
  • Commenti (123)
  • Novità

PR Support And Resistance for MT4

4.53
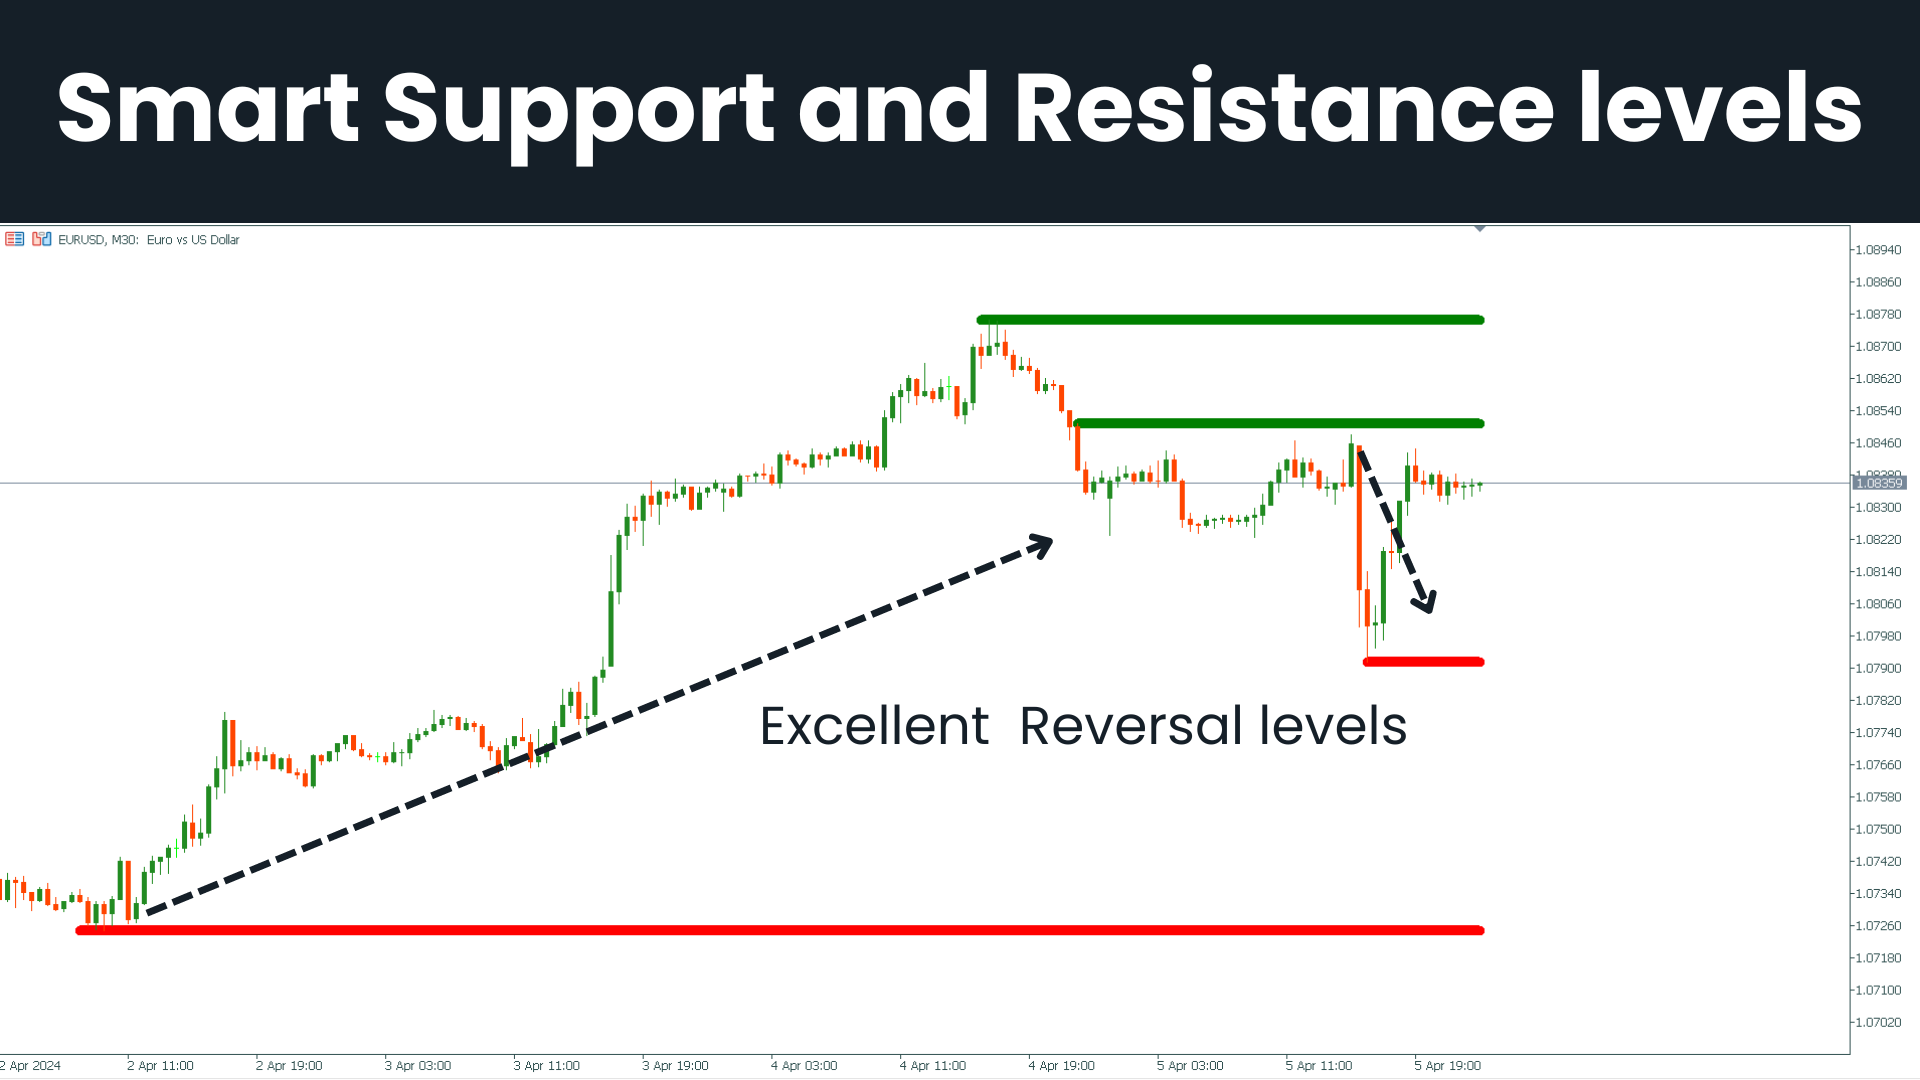
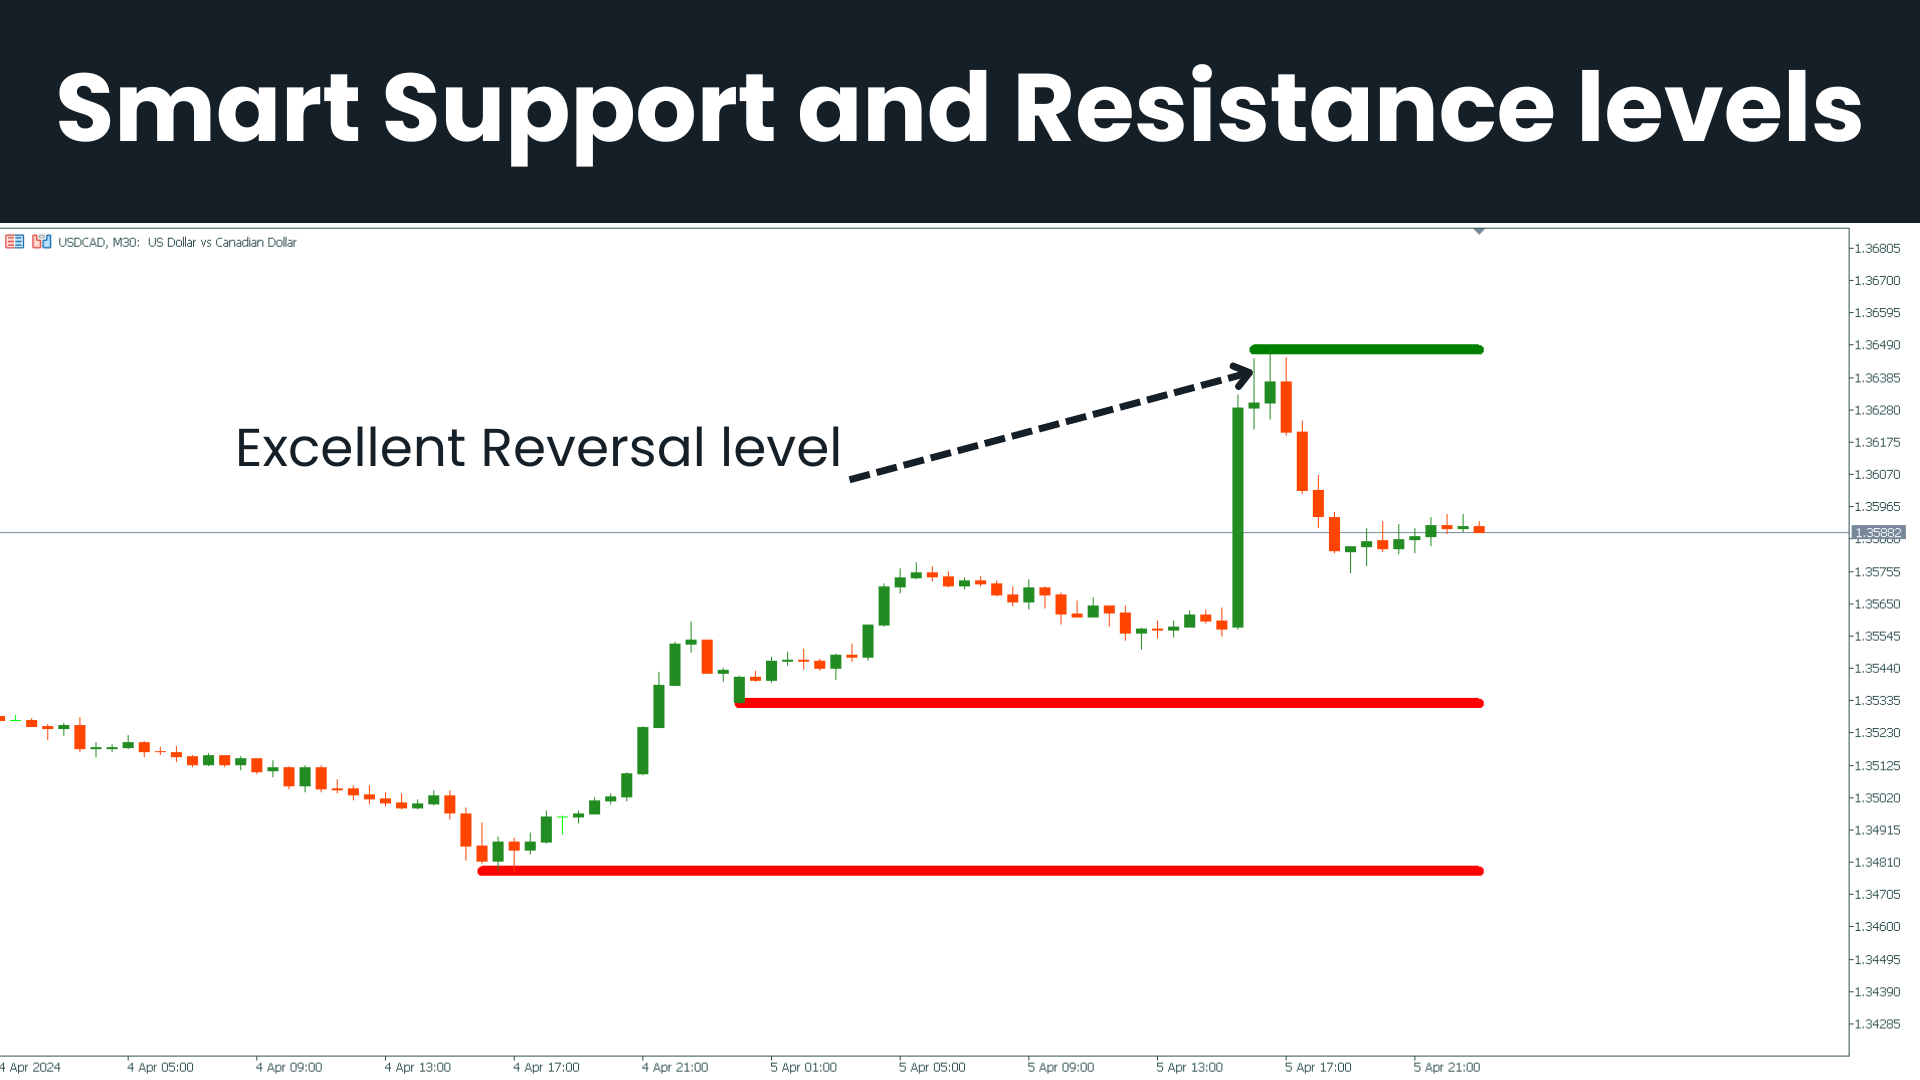
I livelli di supporto o resistenza delle PR si formano quando l'azione dei prezzi di un mercato inverte e cambia direzione, lasciando dietro di sé un picco o un minimo (punto di oscillazione) nel mercato. I livelli di supporto e resistenza possono ritagliarsi range di trading. L'indicatore identifica l'oscillazione alta e l'oscillazione bassa in base alla quantità X di barre (periodo) definita nell'insieme di indicatori.


Nota: se ti piace il nostro indicatore dell'azione dei prezzi, prova il nostro indicatore di tendenza All in one (Segnali di Trend Screener, Trend Line, Strong Trend e Trend Reversal... ecc.). Per ottenerlo Clicca qui


Caratteristiche principali

Un concetto chiave dell'analisi tecnica è che quando un livello di resistenza o supporto viene rotto, il suo ruolo viene invertito. Se il prezzo scende al di sotto di un livello di supporto, quel livello diventerà resistente. Se il prezzo sale al di sopra di un livello di resistenza, diventerà spesso supporto.
I livelli di supporto e resistenza orizzontali sono il tipo più elementare di questi livelli. Sono semplicemente identificati da una linea orizzontale:

  • Il livello verde nel grafico è il livello di resistenza.
  • Il livello rosso nel grafico è un livello di supporto.

Il nostro supporto e resistenza vengono utilizzati per identificare i livelli chiave in cui la tendenza del prezzo ha una maggiore probabilità di arrestarsi e possibilmente cambiare direzione. Può essere un prezzo specifico o un'area di prezzo. L'interpretazione del grado di significatività di un livello dipende dall'orizzonte temporale di un trader.


Documentazione (Istruzioni)

Tutti gli indicatori di supporto e resistenza PR e la documentazione (Istruzioni) sono disponibili in questo post nel nostro blog MQL5: Clicca qui.


Vantaggi del supporto e della resistenza alle pubbliche relazioni
  • Lavorare con tutte le coppie ( Forex, Crypto, Indici e materie prime )
  • Lavorare con tutti i tempi. (Lasso di tempo consigliato: intervalli di tempo H1 e H4)
  • Generatore di avvisi. (Avvisi pop-up, avvisi di notifica push... ecc.)
  • Indicatore gratuito al 100%.

Avvertimento

Tutti i nostri indicatori sono disponibili solo tramite il Metatrader Store ufficiale (mercato MQL5).
Accedendo al nostro profilo MQL5, troverai tutti i nostri indicatori e EA (gratuiti ea pagamento). Per accedere al nostro profilo MQL5 clicca qui.

Contatto

Se hai qualche domanda o se hai bisogno di aiuto, contattami tramite messaggio privato.

Autore

SAYADI ACHREF, ingegnere del software fintech e fondatore di Finansya.
Recensioni 20
Sony Chen
23
Sony Chen 2024.07.15 08:55 
 

Is it possible to return the support value and resistant value ? If I can get the support/resistant values, I could use it in the EA.

gallard_a
239
gallard_a 2024.05.18 08:50 
 

Great support

Laurence Sanders
160
Laurence Sanders 2024.05.17 12:52 
 

Thanks for sharing your knowledge for free.

Prodotti consigliati
Il Catturatore di Tendenza: La Strategia del Catturatore di Tendenza con Indicatore di Allarme è uno strumento versatile di analisi tecnica che aiuta i trader a identificare le tendenze di mercato e i potenziali punti di ingresso e uscita. Presenta una Strategia dinamica del Catturatore di Tendenza, adattandosi alle condizioni di mercato per una chiara rappresentazione visiva della direzione della tendenza. I trader possono personalizzare i parametri in base alle loro preferenze e tolleranza
FREE
Free automatic Fibonacci is an indicator that automatically plots a Fibonacci retracement based on the number of bars you select on the BarsToScan setting in the indicator. The Fibonacci is automatically updated in real time as new highest and lowest values appears amongst the selected bars. You can select which level values to be displayed in the indicator settings. You can also select the color of the levels thus enabling the trader to be able to attach the indicator several times with differe
FREE
The Candle Countdown Timer for MetaTrader 4 (also available for MT5) is a vital indicator designed to help you manage your trading time effectively. It keeps you updated about market open and close times by displaying the remaining time before the current candle closes and a new one forms. This powerful tool enables you to make well-informed trading decisions. Key Features: Asia Range: Comes with an option to extend the range. Broker Time, New York, London Time: Displays the current broker time
FREE
Tipu Heikin Ashi Panel
Kaleem Haider
4.56 (25)
Tipu Heikin-Ashi Panel is the modified version of the original Heiken Ashi indicator published by MetaQuotes here . A professional version of this indicator is available here . Features An easy to use Panel that shows the Heiken Ashi trend of selected timeframe. Customizable Buy/Sell alerts, push alerts, email alerts, or visual on-screen alerts. Customizable Panel. The panel can be moved to any place on the chart or minimized to allow more space. Heikin means "the average", and Ashi means "foo
FREE
Are you tired of drawing trendlines every time you're analyzing charts? Or perhaps you would like more consistency in your technical analysis. Then this is for you. This indicator will draw trend lines automatically when dropped on a chart. How it works Works similar to standard deviation channel found on mt4 and mt5. It has 2 parameters: 1. Starting Bar 2. Number of bars for calculation The   starting bar   is the bar which drawing of the trend lines will begin, while the   number of bars for c
FREE
YOU CAN NOW DOWNLOAD FREE VERSIONS OF OUR PAID INDICATORS . IT'S OUR WAY OF GIVING BACK TO THE COMMUNITY ! >>>    GO HERE TO DOWNLOAD Camarilla Pivots Historical plots the historical data of the camarilla pivot point levels on the chart. The Camarilla Pivot levels was originated in 1989 by Nick Scott. The levels are used as primary support and resistance levels by Intraday traders. The levels are calculated with the following formula: R4 = C + RANGE * 1.1/2 R3 = C + RANGE * 1.1/4 R2 = C + RAN
FREE
TrendPlus
Sivakumar Subbaiya
4.21 (14)
Trend Plus   Trendplus  Indicator   Time Frame: Suitable for any time frame.  Purpose: Trend Prediction. Blue and red candle indicate the buy and sell call respectively. Buy: When the blue candle is formed buy call is initiated. close the buy trades when the next red candle will formed.   Sell: When the Red candle is formed Sell call is initiated. close the Sell trades when the next blue candle will formed.   Happy trade!!
FREE
This indicator alerts you when/before new 1 or 5 minute bar candle formed. In other words,this indicator alerts you every 1/5 minutes. This indicator is especially useful for traders who trade when new bars formed. *This indicator don't work propery in strategy tester.Use this in live trading to check functionality. There is more powerful Pro version .In Pro version,you can choose more timeframe and so on. Input Parameters Alert_Or_Sound =Sound ----- Choose alert or sound or both to not
FREE
Market Profile 3
Hussien Abdeltwab Hussien Ryad
4 (4)
Market Profile 3 MetaTrader 4 indicator  — is a classic Market Profile implementation that can show the price density over time, outlining the most important price levels, value area, and control value of a given trading session. This indicator can be attached to timeframes between M1 and D1 and will show the Market Profile for daily, weekly, monthly, or even intraday sessions. Lower timeframes offer higher precision. Higher timeframes are recommended for better visibility. It is also possible t
FREE
Vanexio
Sayan Vandenhout
5 (1)
VANEXIO USES THE TREND WAVE INDICATOR AND IT CAN IDENTIFY THE BEGINNING AND THE END OF A NEW WAVE TREND MOVEMENT. AS AN OSCILLATOR, THE INDICATOR IDENTIFIES THE OVERBOUGHT AND OVERSOLD ZONES. IT WORKS GREAT TO CATCH THE SHORT TERM PRICE REVERSALS AND USES A MARTINGALE STRATEGY TO CLOSE ALL TRADES IN PROFIT. USE DEFAULT SETTINGS ON H1 OR HIGHER TIME FRAME ON ANY PAIR FOR MORE ACCURATE TRADES WHY THIS EA : Smart entries calculated by 5 great strategies The EA can be run on even a $20000
FREE
FFx Momentum
Eric Venturi-Bloxs
4.33 (3)
The purpose of this new version of the MT4 standard indicator provided in your platform is to display in a sub-window multiple timeframes of the same indicator. See the example shown in the picture below. But the display isn’t like a simple MTF indicator. This is the real display of the indicator on its timeframe. Here's the options available in the FFx indicator: Select the timeframes to be displayed (M1 to Monthly) Define the width (number of bars) for each timeframe box Alert pop up/sound/ema
FREE
Two Period RSI
Libertas LLC
4.5 (8)
Two Period RSI compares long-term and short-term RSI lines, and plots a fill between them for improved visualization. Fill is colored differently according to an uptrend (short period RSI above long period RSI) or a downtrend (short period RSI below long period RSI). Short-term RSI crossing long-term RSI adds a more robust trend confirmation signal than using single period RSI alone. This is a small tool to help visualize and confirm RSI trends. We hope you enjoy! Looking for RSI alerts? You can
FREE
Wise Men Indicator demo
Bohdan Kasyanenko
3.67 (3)
The indicator displays signals according to the strategy of Bill Williams on the chart. Demo version of the indicator has the same features as the paid, except that it can work only on a demo account . Signal "First Wise Man" is formed when there is a divergent bar with angulation.  Bullish divergent bar - with lower minimum and closing price in the upper half. Bearish divergent bar - higher maximum and the closing price at the bottom half. Angulation is formed when all three lines of Alligat
FREE
Wicks UpDown Target GJ Wicks UpDown Target GJ is specialized in GJ forex pairs. Choppy movement up and down on the opening range every day.  Trading breakouts on London session and New York session is recommended. Guideline Entry Strategy Idea: Step 1 - Breakout Forming (Warning! Trade on London Session and New York Session) Step 2 - Breakout Starting (Take Action on your trading plan) Step 3 - Partial Close your order & set breakeven (no-risk) Step 4 - Target complete Step 5 - Don't tr
FREE
Rainbow MT4
Jamal El Alama
Rainbow MT4 is a technical indicator based on Moving average with period 34 and very easy to use. When price crosses above MA and MA changes color to green, it’s a signal to buy. When price crosses below MA and MA changes color to red, it’s a signal to sell. The Expert advisor ( Rainbow EA MT4) based on Rainbow MT4 indicator, as you can see in the short video below is now available here .
FREE
FFx ParabolicSAR
Eric Venturi-Bloxs
4.8 (5)
The purpose of this new version of the MT4 standard indicator provided in your platform is to display in a sub-window multiple timeframes of the same indicator. See the example shown in the picture below. But the display isn’t like a simple MTF indicator. This is the real display of the indicator on its timeframe. Here's the options available in the FFx indicator: Select the timeframes to be displayed (M1 to Monthly) Define the width (number of bars) for each timeframe box Alert pop up/sound/ema
FREE
FFx Force Index
Eric Venturi-Bloxs
5 (4)
The purpose of this new version of the MT4 standard indicator provided in your platform is to display in a sub-window multiple timeframes of the same indicator. See the example shown in the picture below. But the display isn’t like a simple MTF indicator. This is the real display of the indicator on its timeframe. Here's the options available in the FFx indicator: Select the timeframes to be displayed (M1 to Monthly) Define the width (number of bars) for each timeframe box Alert pop up/sound/ema
FREE
Trend arrow Indicator
NGUYEN NGHIEM DUY
3.23 (13)
Trend arrow Indicator is an arrow Indicator used as an assistant tool for your trading strategy. The indicator analyzes the standard deviation of bar close for a given period and generates a buy or sell signals if the deviation increases. It good to combo with Martingale EA to follow Trend and Sellect Buy Only/Sell Only for EA work Semi-Automatic. You can use this  Indicator with any EAs in my Products.
FREE
FFx MACD
Eric Venturi-Bloxs
4.44 (9)
The purpose of this new version of the MT4 standard indicator provided in your platform is to display in a sub-window multiple timeframes of the same indicator. See the example shown in the picture below. But the display isn’t like a simple MTF indicator. This is the real display of the indicator on its timeframe. Here's the options available in the FFx indicator: Select the timeframes to be displayed (M1 to Monthly) Define the width (number of bars) for each timeframe box Alert pop up/sound/ema
FREE
Traditional MACD MT4
Daniel Lewis
4.61 (71)
MACD indicator in MetaTrader 4/5 looks different than MACD does in most other charting software. That is because the MetaTrader 4/5 version of MACD displays the MACD line as a histogram when it is traditionally displayed as a line. Additionally, the MetaTrader 4/5 version computes the Signal line using an SMA, while according to MACD definition it is supposed to be an EMA. The MetaTrader 4/5 version also does not compute a true MACD Histogram (the difference between the MACD/Signal lines). This
FREE
FFx Fractals
Eric Venturi-Bloxs
4.6 (5)
The purpose of this new version of the MT4 standard indicator provided in your platform is to display in a sub-window multiple timeframes of the same indicator. See the example shown in the picture below. But the display isn’t like a simple MTF indicator. This is the real display of the indicator on its timeframe. Here's the options available in the FFx indicator: Select the timeframes to be displayed (M1 to Monthly) Define the width (number of bars) for each timeframe box Alert pop up/sound/ema
FREE
Pip Show - MultiStrategy Trading   The indicator is for free and you have to install it before you can use the Pip Show - MultiStrategy Trading EA. The use of the indicator is very simple, on green open buy positions and on red open sell positions. Its based on a MA calculation. Check out my fully automatic trading robot  multistrategy-trading.com It has four parameters: Period, Divisor ("speed"), Price and TimeFrame Period - how many candles , backwards, are calculating Divisor - how "quick" is
FREE
Discover the power of precision and efficiency in your trading with the " Super Auto Fibonacci " MT4 indicator. This cutting-edge tool is meticulously designed to enhance your technical analysis, providing you with invaluable insights to make informed trading decisions. Key Features: Automated Fibonacci Analysis: Say goodbye to the hassle of manual Fibonacci retracement and extension drawing. "Super Auto Fibonacci" instantly identifies and plots Fibonacci levels on your MT4 chart, saving you tim
FREE
Ppr PA
Yury Emeliyanov
4.75 (4)
"Ppr PA" is a unique technical indicator created to identify "PPR" patterns on the currency charts of the MT4 trading platform. These patterns can indicate possible reversals or continuation of the trend, providing traders with valuable signals to enter the market. Features: Automatic PPR Detection:   The indicator automatically identifies and marks PPR patterns with arrows on the chart. Visual Signals:   Green and red arrows indicate the optimal points for buying and selling, respectively. A
FREE
Follow The Line
Oliver Gideon Amofa Appiah
4.07 (14)
FOLLOW THE LINE GET THE FULL VERSION HERE: https://www.mql5.com/en/market/product/36024 This indicator obeys the popular maxim that: "THE TREND IS YOUR FRIEND" It paints a GREEN line for BUY and also paints a RED line for SELL.  It gives alarms and alerts of all kinds. IT DOES NOT REPAINT and can be used for all currency pairs and timeframes. Yes, as easy and simple as that. Even a newbie can use it to make great and reliable trades. NB: For best results, get my other premium indicators for more
FREE
PZ Pivot Points
PZ TRADING SLU
4.64 (14)
This indicator displays pivot points in the chart, including historical vales, and supports many calculation modes for Pivot Points and S/R levels.  [ Installation Guide | Update Guide | Troubleshooting | FAQ | All Products ] It plots historical levels for backtesting purposes It allows you to select the reference timeframe It implements different Pivot Point calculation modes It implements different SR calculation modes It implements customizable colors and sizes Calculation Modes The indi
FREE
Trade History for MT4  This indicator is specially developed for that traders want to display his trades on the charts. Shows history and current deals on the chart. Trades show on the chart with a dotted line, and profit will show realtime. Buy trades are displayed in bull color, Sell trades in bear color. Tip: The historical order displayed by the indicator is associated with the "Account History", so please set the historical order display in the "Account History" of MT software. If yo
FREE
Gli utenti di questo prodotto hanno anche acquistato
Gann Made Easy
Oleg Rodin
4.88 (99)
Gann Made Easy è un sistema di trading Forex professionale e facile da usare che si basa sui migliori principi del trading utilizzando la teoria di mr. WD Gann. L'indicatore fornisce segnali ACQUISTA e VENDI accurati, inclusi i livelli di Stop Loss e Take Profit. Puoi fare trading anche in movimento utilizzando le notifiche PUSH. Vi prego di contattarmi dopo l'acquisto! Condividerò i miei consigli di trading con te e fantastici indicatori bonus gratuitamente! Probabilmente hai già sentito parlar
Trend Punch
Mohamed Hassan
4.91 (23)
This indicator is unstoppable when combined with our other indicator called  Support & Resistance . After purchase, send us a message and you will get it   for  FREE as a BONUS! Introducing Trend Punch , the revolutionary forex trend indicator that will transform the way you trade! Trend Punch is uniquely designed to provide precise buy and sell arrows during strong market trends, making your trading decisions clearer and more confident. Whether you're trading major currency pairs or exotic sym
Gold Stuff
Vasiliy Strukov
4.9 (269)
Gold Stuff è un indicatore di tendenza progettato specificamente per l'oro e può essere utilizzato anche su qualsiasi strumento finanziario. L'indicatore non ridisegna e non è in ritardo. Periodo consigliato H1. Su di esso l'indicatore funziona in modo completamente automatico Expert Advisor EA Gold Stuff. Lo trovi nel mio profilo. I risultati in tempo reale possono essere visualizzati qui.  Puoi ottenere una copia gratuita del nostro indicatore Strong Support e Trend Scanner, per favore scri
Trend Pulse
Mohamed Hassan
5 (5)
Please contact me after purchase to immediately get your PDF strategy + documentation for Trend Pulse !  Official release price of $89  (2 /50 copies left). Next price is $199 . Introducing Trend Pulse , a unique and robust indicator capable of detecting bullish, bearish, and even ranging trends! Trend Pulse uses a special algorithm to filter out market noise with real precision. If the current symbol is moving sideways, Trend Pulse will send you a ranging signal, letting you know that it'
Atomic Analyst
Issam Kassas
5 (3)
Innanzitutto, vale la pena sottolineare che questo indicatore di trading non è repaint, non è ridisegno e non presenta ritardi, il che lo rende ideale sia per il trading manuale che per quello automatico. Manuale utente: impostazioni, input e strategia. L'Analista Atomico è un indicatore di azione del prezzo PA che utilizza la forza e il momentum del prezzo per trovare un miglior vantaggio sul mercato. Dotato di filtri avanzati che aiutano a rimuovere rumori e segnali falsi, e aumentare il pote
Scalper Inside PRO
Alexey Minkov
4.75 (60)
An exclusive indicator that utilizes an innovative algorithm to swiftly and accurately determine the market trend. The indicator automatically calculates opening, closing, and profit levels, providing detailed trading statistics. With these features, you can choose the most appropriate trading instrument for the current market conditions. Additionally, you can easily integrate your own arrow indicators into Scalper Inside Pro to quickly evaluate their statistics and profitability. Scalper Inside
Attualmente 20% di sconto! La soluzione migliore per ogni principiante o trader esperto! Questo software per cruscotti funziona su 28 coppie di valute. Si basa su 2 dei nostri indicatori principali (Advanced Currency Strength 28 e Advanced Currency Impulse). Offre un'ottima panoramica dell'intero mercato Forex. Mostra i valori di forza delle valute avanzate, la velocità di movimento delle valute e i segnali per 28 coppie Forex in tutti i (9) timeframe. Immaginate come migliorerà il vostro t
Enigmera
Ivan Stefanov
5 (4)
ENIGMERA: Il cuore del mercato https://www.enigmera.com Introduzione Questo indicatore e sistema di trading rappresenta un approccio straordinario ai mercati finanziari. ENIGMERA utilizza i cicli frattali per calcolare con precisione i livelli di supporto e resistenza. Mostra l'autentica fase di accumulazione e fornisce direzione e obiettivi.  Un sistema che funziona sia in un trend che in una correzione.  Come funziona? ENIGMERA è composto da tre linee: la linea di supporto/resistenza, la
PZ Day Trading
PZ TRADING SLU
3.67 (3)
Effortless trading: non-repainting indicator for accurate price reversals Special Offer: Purchase now to receive free bonuses worth $189! (Read more for details) This indicator detects price reversals in a zig-zag fashion, using only price action analysis and a donchian channel. It has been specifically designed for short-term trading, without repainting or backpainting at all. It is a fantastic tool for shrewd traders aiming to increase the timing of their operations. [ Installation Guide | Up
ATTUALMENTE SCONTATO DEL 26% La soluzione migliore per ogni principiante o trader esperto! Questo indicatore è uno strumento di trading unico, di alta qualità e conveniente perché abbiamo incorporato una serie di caratteristiche proprietarie e una nuova formula. Con un solo grafico è possibile leggere la forza delle valute per 28 coppie Forex! Immaginate come migliorerà il vostro trading perché sarete in grado di individuare l'esatto punto di innesco di una nuova tendenza o di un'opportunit
Currency Strength Wizard è un indicatore molto potente che ti fornisce una soluzione all-in-one per un trading di successo. L'indicatore calcola la potenza di questa o quella coppia forex utilizzando i dati di tutte le valute su più intervalli di tempo. Questi dati sono rappresentati in una forma di indice di valuta facile da usare e linee elettriche di valuta che puoi utilizzare per vedere il potere di questa o quella valuta. Tutto ciò di cui hai bisogno è collegare l'indicatore al grafico che
TPSproTREND PrO
Roman Podpora
4.78 (18)
TPSpro TREND PRO   è un indicatore di tendenza che analizza automaticamente il mercato, fornisce informazioni sulla tendenza e sui rispettivi cambiamenti e fornisce segnali per entrare nelle operazioni senza ridisegnare. L'indicatore utilizza ciascuna candela e la analizza separatamente. Si riferisce a vari shock al rialzo o al ribasso. Punto di ingresso preciso per il trading di valute, criptovalute, metalli, azioni e indici! Versione MT5                   Descrizione completa dell'indicatore
FX Power MT4 NG
Daniel Stein
5 (12)
Ricevi il tuo aggiornamento quotidiano sul mercato con dettagli e schermate tramite il nostro Morning Briefing qui su mql5 e su Telegram ! FX Power MT4 NG è la nuova generazione del nostro popolare misuratore di forza delle valute, FX Power. Cosa offre questo misuratore di forza di nuova generazione? Tutto ciò che avete amato dell'FX Power originale IN PIÙ Analisi della forza di ORO/XAU Risultati di calcolo ancora più precisi Periodi di analisi configurabili individualmente Limite di calcolo pe
Trend Screener
STE S.S.COMPANY
4.82 (92)
Indicatore di tendenza, soluzione unica rivoluzionaria per il trading di tendenze e il filtraggio con tutte le importanti funzionalità di tendenza integrate in un unico strumento! È un indicatore multi-timeframe e multi-valuta al 100% non ridipingibile che può essere utilizzato su tutti i simboli/strumenti: forex, materie prime, criptovalute, indici e azioni. Trend Screener è un indicatore di tendenza che segue un indicatore efficiente che fornisce segnali di tendenza a freccia con punti nel gra
Advanced Currency IMPULSE with ALERT
Bernhard Schweigert
4.91 (495)
ATTUALMENTE SCONTATO DEL 31%! La soluzione migliore per ogni principiante o trader esperto! Questo indicatore è uno strumento di trading unico, di alta qualità e conveniente perché abbiamo incorporato una serie di caratteristiche proprietarie e una formula segreta. Con un solo grafico fornisce avvisi per tutte le 28 coppie di valute. Immaginate come migliorerà il vostro trading perché sarete in grado di individuare l'esatto punto di innesco di una nuova tendenza o opportunità di scalping!
- Real price is 80$ - 40% Discount ( It is 49$ now ) Contact me for instruction, any questions! Introduction The breakout and retest strategy is traded support and resistance levels. it involves price breaking through a previous level.  The break and retest strategy is designed to help traders do two main things, the first is to avoid false breakouts. Many false breakouts start with a candlestick that breaks out of a level but ends with an immediate candlestick that brings the price back into t
PRO Renko System
Oleg Rodin
5 (26)
PRO Renko System è un sistema di trading altamente accurato appositamente progettato per il trading di grafici RENKO. Questo è un sistema universale che può essere applicato a vari strumenti di trading. Il sistema neutralizza efficacemente il cosiddetto rumore di mercato che consente di accedere a segnali di inversione accurati. L'indicatore è molto facile da usare e ha un solo parametro responsabile della generazione del segnale. Puoi facilmente adattare lo strumento a qualsiasi strumento
Gold Channel is a volatility-based indicator, developed with a specific timing algorithm for the XAUUSD pair, which consists of finding possible corrections in the market. This indicator shows two outer lines, an inner line (retracement line) and an arrow sign, where the theory of the channel is to help identify overbought and oversold conditions in the market. The market price will generally fall between the boundaries of the channel. If prices touch or move outside the channel it is a tra
Order Block Hunter
Noha Mohamed Fathy Younes Badr
5 (2)
Order block hunter indicator is the best indicator for  hunt the order blocks that area where there has been a large concentration of limit orders waiting to be executed Order blocks are identified on a chart by observing previous price action and looking for areas where the price experienced significant movement or sudden changes in direction .This indicator does that for you by using very complicated codes and helps you to take the best areas To buy and sell because it make marks at the best a
Innanzitutto, vale la pena sottolineare che questo Strumento di Trading è un Indicatore Non-Ridipingente, Non-Ridisegnante e Non-Laggante, il che lo rende ideale per il trading professionale. Corso online, manuale utente e demo. L'Indicatore Smart Price Action Concepts è uno strumento molto potente sia per i nuovi che per i trader esperti. Racchiude più di 20 utili indicatori in uno solo, combinando idee di trading avanzate come l'Analisi del Trader del Circolo Interno e le Strategie di Trading
SI PREGA DI LEGGERE LE INFORMAZIONI QUI SOTTO PRIMA DI ACQUISTARE IL PRODOTTO! Apollo Pips PLUS SP è un prodotto unico! È PER CHI VUOLE OTTENERE IL MIO NUOVO INDICATORE "APOLLO PIPS" PIÙ IL BONUS "SUPER PACK" CON ACCESSO A TUTTI I MIEI INDICATORI DI TRADING! Acquistando il prodotto Apollo Pips PLUS SP stai effettivamente acquistando una versione assolutamente nuova del mio indicatore Apollo Pips. Questa versione dell'indicatore ha un algoritmo migliorato e un parametro facile da usare che ti dà
Scalper Vault
Oleg Rodin
5 (29)
Scalper Vault è un sistema di scalping professionale che ti fornisce tutto il necessario per scalping di successo. Questo indicatore è un sistema di trading completo che può essere utilizzato dai trader di forex e opzioni binarie. L'intervallo di tempo consigliato è M5. Il sistema fornisce segnali di freccia accurati nella direzione della tendenza. Ti fornisce anche i segnali più alti e più bassi e i livelli di mercato di Gann. Gli indicatori forniscono tutti i tipi di avvisi, comprese le notifi
NAM Order Blocks
NAM TECH GROUP, CORP.
5 (1)
MT4 Multi-timeframe Order Blocks detection indicator. Features - Fully customizable on chart control panel, provides complete interaction. - Hide and show control panel wherever you want. - Detect OBs on multiple timeframes. - Select OBs quantity to display. - Different OBs user interface. - Different filters on OBs. - OB proximity alert. - ADR High and Low lines. - Notification service (Screen alerts | Push notifications). Summary Order block is a market behavior that indicates order collection
TPSpro RFI Levels
Roman Podpora
4.83 (24)
Inverti il primo livello di impulso (RFI)       istruire       Russia       -        ESP   Raccomandazione di utilizzare   l'indicatore -   TPSpro   Trend Edizione Professional -Versione   MT5 La cosa più importante nel comercio son è la cosa più importante in futuro. La cosa più importante è la cosa più importante. Funzioni principali: La maggior parte delle zone sono attivate da venditori e compradores! Indicador mostra tutti i livelli/zone dei primi impulsi corretti per acquisti e vendite. LO
PZ Trend Trading
PZ TRADING SLU
4.8 (5)
Capture every opportunity: your go-to indicator for profitable trend trading Special Offer: Purchase now to receive free bonuses worth $159! (Read more for details) Trend Trading is an indicator designed to profit as much as possible from trends taking place in the market, by timing pullbacks and breakouts. It finds trading opportunities by analyzing what the price is doing during established trends. [ Installation Guide | Update Guide | Troubleshooting | FAQ | All Products ] Trade financial
Scopri il segreto per il trading Forex di successo con il nostro indicatore MT4 personalizzato! Ti sei mai chiesto come raggiungere il successo nel mercato Forex, guadagnando costantemente profitti minimizzando il rischio? Ecco la risposta che hai cercato! Permettici di presentare il nostro indicatore MT4 proprietario che rivoluzionerà il tuo approccio al trading. Versatilità unica Il nostro indicatore è appositamente progettato per gli utenti che preferiscono le formazioni di candele Ren
Clear Breakout
Martin Alejandro Bamonte
5 (1)
L'indicatore "Breakout Buy-Sell" è progettato per identificare e evidenziare potenziali opportunità di acquisto e vendita basate su breakout di prezzo durante diverse sessioni di mercato (Tokyo, Londra e New York). Questo indicatore aiuta i trader a visualizzare chiaramente le zone di acquisto e vendita, nonché i livelli di take-profit (TP) e stop-loss (SL). Strategia di utilizzo L'indicatore può essere utilizzato come segue: Impostazione iniziale : Seleziona la sessione di mercato e regola il G
RelicusRoad Pro
Relicus LLC
4.73 (141)
Ora $ 147 (aumentando a $ 499 dopo alcuni aggiornamenti) - account illimitati (PC o MAC) Manuale utente di RelicusRoad + Video di formazione + Accesso al gruppo Discord privato + Stato VIP UN NUOVO MODO DI GUARDARE IL MERCATO RelicusRoad è l'indicatore di trading più potente al mondo per forex, futures, criptovalute, azioni e indici, fornendo ai trader tutte le informazioni e gli strumenti di cui hanno bisogno per rimanere redditizi. Forniamo analisi tecniche e piani di trading per aiuta
M1 Arrow
Oleg Rodin
4.73 (15)
Una strategia intraday basata su due principi fondamentali del mercato. L'algoritmo si basa sull'analisi dei volumi e delle onde di prezzo utilizzando filtri aggiuntivi. L'algoritmo intelligente dell'indicatore fornisce un segnale solo quando due fattori di mercato si combinano in uno solo. L'indicatore calcola le onde di un certo intervallo sul grafico M1 utilizzando i dati dell'intervallo di tempo più alto. E per confermare l'onda, l'indicatore utilizza l'analisi per volume. Questo indicatore
Advanced Supply Demand
Bernhard Schweigert
4.9 (314)
CURRENTLY 26% OFF !! Best Solution for any Newbie or Expert Trader! This indicator is a unique, high quality and affordable trading tool because we have incorporated a number of proprietary features and a new formula. With this update, you will be able to show double timeframe zones. You will not only be able to show a higher TF but to show both, the chart TF, PLUS the higher TF: SHOWING NESTED ZONES. All Supply Demand traders will love it. :) Important Information Revealed Maximize the potenti
Altri dall’autore
Trend Screener Pro MT5
STE S.S.COMPANY
4.88 (67)
Indicatore di tendenza, soluzione unica rivoluzionaria per il trading di tendenze e il filtraggio con tutte le importanti funzionalità di tendenza integrate in un unico strumento! È un indicatore multi-timeframe e multi-valuta al 100% non ridipingibile che può essere utilizzato su tutti i simboli/strumenti: forex, materie prime, criptovalute, indici e azioni. Trend Screener è un indicatore di tendenza che segue un indicatore efficiente che fornisce segnali di tendenza a freccia con punti nel gra
Trend Screener
STE S.S.COMPANY
4.82 (92)
Indicatore di tendenza, soluzione unica rivoluzionaria per il trading di tendenze e il filtraggio con tutte le importanti funzionalità di tendenza integrate in un unico strumento! È un indicatore multi-timeframe e multi-valuta al 100% non ridipingibile che può essere utilizzato su tutti i simboli/strumenti: forex, materie prime, criptovalute, indici e azioni. Trend Screener è un indicatore di tendenza che segue un indicatore efficiente che fornisce segnali di tendenza a freccia con punti nel gra
Support Resistance screnner
STE S.S.COMPANY
4.87 (38)
Support And Resistance Screener è in un indicatore di livello per MetaTrader che fornisce più strumenti all'interno di un indicatore. Gli strumenti disponibili sono: 1. Screener della struttura del mercato. 2. Zona di ritiro rialzista. 3. Zona di ritiro ribassista. 4. Punti pivot giornalieri 5. Punti pivot settimanali 6. Punti pivot mensili 7. Forte supporto e resistenza basati sul modello e sul volume armonici. 8. Zone a livello di banca. OFFERTA A TEMPO LIMITATO: il supporto HV e l'indicatore
Trend Line Map Pro
STE S.S.COMPANY
4.5 (16)
Trend Line Map indicator is an addons for Trend Screener Indicator . It's working as a scanner for all signals generated by Trend screener ( Trend Line Signals ) . It's a Trend Line Scanner based on Trend Screener Indicator.  If you don't have Trend Screener Pro Indicator, the Trend Line Map Pro will not work. LIMITED TIME OFFER : Trend Line Map Indicator is available for only 50 $ and lifetime. ( Original price 125$ ) By accessing to our MQL5 Blog,  you can find all our premium indicators w
Trend Line Map Pro MT5
STE S.S.COMPANY
4.17 (12)
Trend Line Map indicator is an addons for   Trend Screener Indicator . It's working as a scanner for all signals generated by Trend screener ( Trend Line Signals ) . It's a Trend Line Scanner based on Trend Screener Indicator.  If you don't have Trend Screener Pro Indicator,   the Trend Line Map Pro will not work.     LIMITED TIME OFFER : Trend Line Map Indicator is available for only 50 $ and lifetime. ( Original price 125$ ) By accessing to our MQL5 Blog,  you can find all our premium indica
Ogni trader sa che non dovrebbe mai rischiare più del 5% (o 7%) per operazione.  Questa è una legge sulla gestione del denaro e un LotSize utilizzabile dovrebbe essere calcolato ogni volta perché un trader deve utilizzare un valore StopLoss diverso per diversi livelli di trading.  Questo indicatore calcolerà un LotSize appropriato per il momento in cui lo metterai sul grafico e ogni volta trascinerai la "Stop Loss Line" in qualsiasi direzione. OFFERTA A TEMPO LIMITATO: Tutti i nostri indica
L'indicatore Boom and Crash Spike Detector è codificato in base a una strategia avanzata principalmente per rilevare il boom e il crash nei prezzi. Algoritmi complessi sono stati impiantati per rilevare boom e crash ad alta probabilità nei prezzi. Avvisa su potenziali fasi di boom o arresto anomalo: Fase boom: quando il prezzo aumenta troppo velocemente. Crash Phase: quando il prezzo diminuisce troppo velocemente. OFFERTA A TEMPO LIMITATO: L'indicatore è disponibile per soli 30$ e per tutta
Currency Strength Meter, gives you a quick visual guide to which currencies are currently strong, and which ones are weak. The meter measures the strength of all forex cross pairs and applies calculations on them to determine the overall strength for each individual currency. We calculate based the strength of currency based on the trend of 28 pairs. By accessing to our MQL5 Blog,  you can download the   Demo   Version of the indicator. Try it before you buy ,without the Metatrader Tester rest
Currency strength meter gives you a quick visual guide to which currencies are currently strong, and which ones are weak. The meter measures the strength of all forex cross pairs and applies calculations on them to determine the overall strength for each individual currency.We calculate based the strength of currency based on the trend of 28 pairs. LIMITED TIME OFFER : Trend CSM Indicator is available for only 50 $. ( Original price 125$ ) By accessing to our MQL5 Blog,  you can find all our
Ogni trader sa che non dovrebbe mai rischiare più del 5% (o 7%) per operazione.  Questa è una legge sulla gestione del denaro e un LotSize utilizzabile dovrebbe essere calcolato ogni volta perché un trader deve utilizzare un valore StopLoss diverso per diversi livelli di trading.  Questo indicatore calcolerà un LotSize appropriato per il momento in cui lo metterai sul grafico e ogni volta trascinerai la "Stop Loss Line" in qualsiasi direzione. OFFERTA A TEMPO LIMITATO: Tutti i nostri indica
L'intervallo medio giornaliero mostra l'intervallo di pip medio di una coppia Forex misurata in un certo numero di periodi. I trader possono utilizzare l'ADR per visualizzare la potenziale azione sui prezzi al di fuori del movimento medio giornaliero. Quando l'ADR è al di sopra della media, significa che la volatilità giornaliera è superiore al normale, il che implica che la coppia di valute potrebbe estendersi oltre la sua norma. Il nostro Analizzatore ADR è composto da 5 caratteristiche pri
L'analizzatore di volatilità è un indicatore di momentum, che sfrutta la tendenza del prezzo a scoppiare fortemente dopo essersi consolidato in un range di trading ristretto. L'indicatore utilizza anche un oscillatore del momentum per mostrare la direzione prevista della mossa quando scatta la compressione. Questo istogramma oscilla attorno alla linea dello zero, l'aumento dello slancio al di sopra della linea dello zero indica un'opportunità di acquistare long, mentre lo slancio che scende al
L'indicatore Boom and Crash Spike Detector è codificato in base a una strategia avanzata principalmente per rilevare il boom e il crash nei prezzi. Algoritmi complessi sono stati impiantati per rilevare boom e crash ad alta probabilità nei prezzi. Avvisa su potenziali fasi di boom o arresto anomalo: Fase boom: quando il prezzo aumenta troppo velocemente. Crash Phase: quando il prezzo diminuisce troppo velocemente. OFFERTA A TEMPO LIMITATO: L'indicatore è disponibile per soli 30$ e per tutta
L'intervallo medio giornaliero mostra l'intervallo di pip medio di una coppia Forex misurata in un certo numero di periodi. I trader possono utilizzare l'ADR per visualizzare la potenziale azione sui prezzi al di fuori del movimento medio giornaliero. Quando l'ADR è al di sopra della media, significa che la volatilità giornaliera è superiore al normale, il che implica che la coppia di valute potrebbe estendersi oltre la sua norma. Il nostro Analizzatore ADR è composto da 5 caratteristiche pri
L'analizzatore di volatilità è un indicatore di momentum, che sfrutta la tendenza del prezzo a scoppiare fortemente dopo essersi consolidato in un range di trading ristretto. L'indicatore utilizza anche un oscillatore del momentum per mostrare la direzione prevista della mossa quando scatta la compressione. Questo istogramma oscilla attorno alla linea dello zero, l'aumento dello slancio al di sopra della linea dello zero indica un'opportunità di acquistare long, mentre lo slancio che scende al
Filtro:
Eben2705
123
Eben2705 2024.07.28 10:44 
 

Its good.

Sony Chen
23
Sony Chen 2024.07.15 08:55 
 

Is it possible to return the support value and resistant value ? If I can get the support/resistant values, I could use it in the EA.

-Murlakatam-
14
-Murlakatam- 2024.07.07 08:08 
 

Не отображается ваш продукт.

gallard_a
239
gallard_a 2024.05.18 08:50 
 

Great support

Laurence Sanders
160
Laurence Sanders 2024.05.17 12:52 
 

Thanks for sharing your knowledge for free.

rovinades
414
rovinades 2024.05.17 12:06 
 

So worth it.

Solene Clement
354
Solene Clement 2024.05.17 11:19 
 

So awesome.

Papito63
14
Papito63 2024.05.16 20:08 
 

nicz

Troy
219
Troy 2024.05.09 09:21 
 

This is great

JayFx
185
JayFx 2024.05.09 08:25 
 

This is so awesome. Glad to have this

Calix Fujimoto
462
Calix Fujimoto 2024.05.08 08:58 
 

This is so awesome. Thanks for sharing.

Nathan Lourigan
64
Nathan Lourigan 2024.04.17 16:30 
 

L'utente non ha lasciato alcun commento sulla valutazione.

Tristan Chatfield
61
Tristan Chatfield 2024.04.16 18:40 
 

L'utente non ha lasciato alcun commento sulla valutazione.

Andrew Ellul
65
Andrew Ellul 2024.04.16 16:30 
 

L'utente non ha lasciato alcun commento sulla valutazione.

Jeremy johnston
65
Jeremy johnston 2024.04.16 16:24 
 

L'utente non ha lasciato alcun commento sulla valutazione.

Genkam Bouris
76
Genkam Bouris 2024.04.16 13:56 
 

L'utente non ha lasciato alcun commento sulla valutazione.

sean bassett
81
sean bassett 2024.04.16 11:18 
 

L'utente non ha lasciato alcun commento sulla valutazione.

aodthth
426
aodthth 2024.04.11 10:16 
 

Excellent indicator

STE S.S.COMPANY
288430
Risposta dello sviluppatore Sayadi Achraf 2024.04.15 02:32
Thank you for taking time to write your review. I'm happy to know that you find our indicator a useful indicator for you. Since 4 years, we are doing our best to keep improving and giving the best indicators for our customers. Please if you have any suggestions or comments about our indicator, feel free to contact us. I invite you to check all the list of all our free and premium indicators here : https://www.mql5.com/en/users/sayadi_lancer/seller
545468
14
545468 2024.04.02 08:59 
 

111

STE S.S.COMPANY
288430
Risposta dello sviluppatore Sayadi Achraf 2024.04.02 12:04
Thank you for taking time to write your review. Can i know what issue you're facing with our price action support and resistance indicator ?
-- Best regards.
Sayadi Ashref.
50712345
25
50712345 2024.03.27 09:15 
 

it is of no great use as it is a donchian channel duplicate

Rispondi alla recensione
Versione 12.0 2024.04.09
1. Improve level detections
Versione 11.0 2024.03.24
1. Compiled with last MT4 version
Versione 9.10 2021.07.09
1. Add alerts.
Versione 9.0 2021.07.01
1. Add swing high and low algorithme.
Versione 8.20 2021.06.24
1. Updating algorithm.
Versione 8.10 2021.06.15
1. Add Line Width.
Versione 8.0 2021.06.14
1. Optiming PA algorithm for small timeframe.
Versione 7.60 2021.06.13
1. Updating the indicator to follow the new Market Rules.
Versione 7.50 2021.05.08
1. Optimizing indicator speed.
Versione 7.40 2021.04.20
1. Changing default setting.
Versione 7.30 2021.04.18
1. Add pairs screener.
Versione 7.10 2020.08.25
1. Optimizing the algorithm of identifying strong support and resistance.
Versione 6.10 2020.04.21
1. Fixing Alert issue.
2. Add hide-display dashboard.
Versione 6.0 2020.04.21
1. Add second control to clean the chart.
Versione 5.0 2020.04.09
1. Adjusting default setting.
Versione 3.33 2020.03.10
1. Optimizing indicator logic.
Versione 2.21 2020.03.05
1. Adjusting features available in the free version.
Versione 2.20 2020.02.22
1. Add color for strong zones.
2. Add Display Strong zones only feature. ( pro version )
Versione 2.10 2020.02.15
1. Change default setting
Versione 2.0 2020.02.15
1. Add Strong and support zones
Versione 1.20 2020.02.15
- Changing default Setting to H4 timeframe.