PointsVsBars
- Indicatori
- Stanislav Korotky
- Versione: 1.1
- Aggiornato: 24 novembre 2021
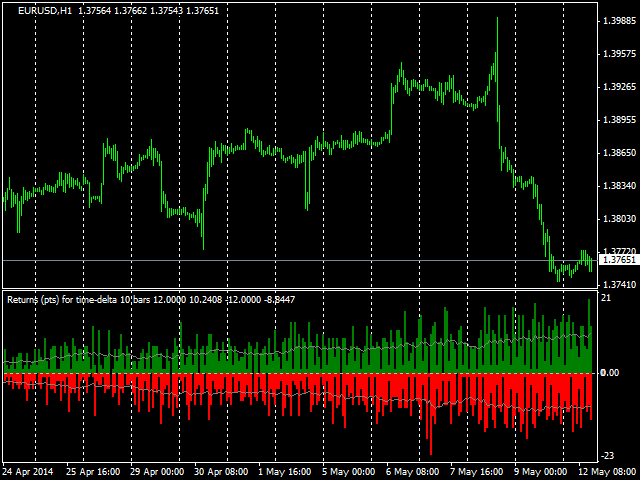
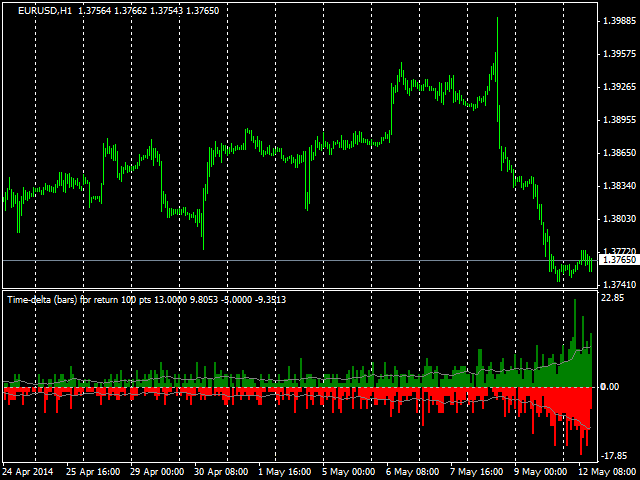
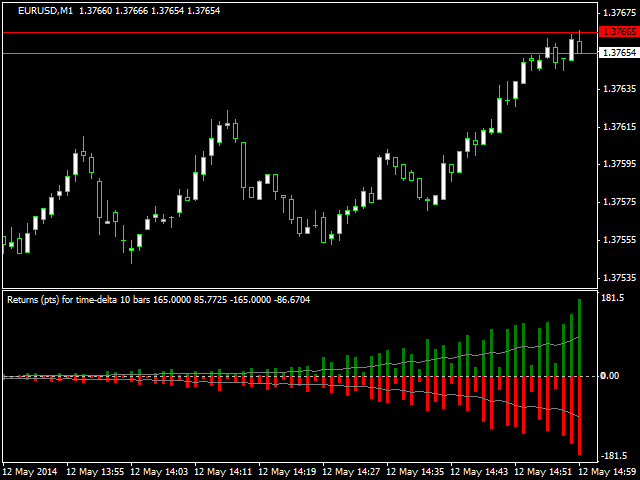
This indicator provides a statistical analysis of price changes (in points) versus time delta (in bars). It calculates a matrix of full statistics about price changes during different time periods, and displays either distribution of returns in points for requested bar delta, or distribution of time deltas in bars for requested return.
Please, note, that the indicator values are always a number of times corresponding price change vs bar delta occurred in history.
Parameters:
- HistoryDepth - number of bars to use for statistic calculation; by default - 5000;
- TimeDeltaBars - requested time delta in bars, for which to show stats for different returns; if this parameter is larger than 0, and RangeDeltaPoints is 0 (by default), the indicator shows a histogram with returns in points along horizontal axis and number of times, when the requested bar delta resulted in corresponding price change, as values; by default - 10; maximal allowed value is 1000;
- RangeDeltaPoints - requested return in points, for which to show stats for different bar deltas; if this parameter is larger than 0, the indicator shows a histogram with bar deltas along horizontal axis and number of times, when the requested return was observed for corresponding bar delta, as values; by default - 0, which means that paramaters TimeDeltaBars takes precedence; maximal allowed value is 2000 for 5-digit quotes, and 200 for 4-digit quotes;
- MA - period for smoothing by SMA; by default - 11;
- Offset - number of bar to shift statistic calculation back in history;
RangeDeltaPoints and TimeDeltaBars cannot be 0 both. If RangeDeltaPoints is not 0, a histogram of bar deltas is shown, no matter what value TimeDeltaBars is. If RangeDeltaPoints is 0, TimeDeltaBars should be greater than 0, and a histogram of price deltas is shown.
The indicator can be used to discover specifics of various instruments and peculiarities in quotes. It also provides essential information for predicting future price changes - for example, the same matrix is used for calculating price change probabilities in a related indicator - PriceProbablility.
The indicator uses open prices and does not redraw on ticks.

