• Panoramica
  • Recensioni
  • Commenti

ChzhshchMACD

Parlando dell'indicatore Zen MACD

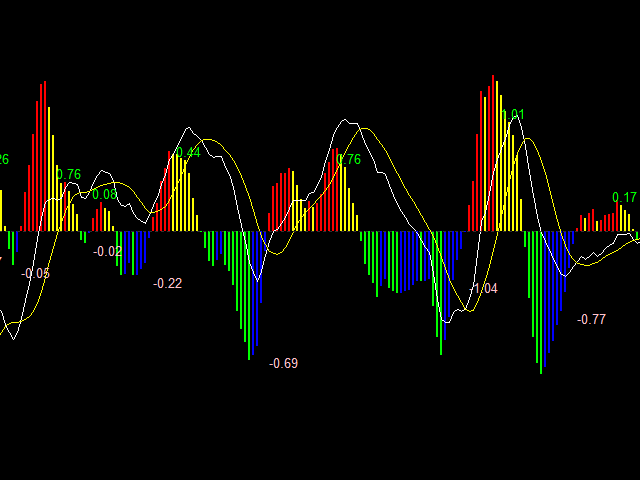
MACD a quattro colori a due fili

Mostra la somma dell'area della colonna

InpFastMA=12; // Periodo EMA veloce

InpSlowMA=26; // Periodo EMA lento

InpSignalMA=9; // Segnale SMA periodo

InpAppliedPrice=PRICE_CLOSE;// Prezzo applicato

InpMaMethod=MODE_EMA; //Ma_Method

input bool ChArea = false; //chzhshch Area

Parametri linea veloce periodo EMA veloce

Parametri della linea lenta del periodo EMA lento

Parametri della linea del segnale del periodo SMA del segnale

Prezzo dell'applicazione opzionale

Contrasta la forza della tendenza definita nella teoria della torsione, confronta le due tendenze e confronta la somma dell'area della colonna

Questo indicatore calcola l'area corrispondente e facilita il confronto
Prodotti consigliati
The DYJ SignalSourceOfMACD is based on the MACD indicator. Generally, signals are generated when crossing the MACD and SIGNAL lines of the MACD indicator.  Signals to buy   are generated if the MACD line crosses over the SIGNAL line in the negative area below the MACD open level. The negative area is where the values of MACD and SIGNAL lines are below zero. The MACD open level parameter is set in pips. However, in the code it is converted as follows: MACD Open level * Instrument.PipSize. For exa
Buy CTS scalping indicator, provide buying and selling signals, automatic channeling and sending signals to mobile phones Using technical analysis and price action methods and modern methods, CTS indicator can draw price channels and recognize price trends with high accuracy and issue entry and exit signals according to them. Traders can easily fluctuate using this indicator in different time frames and in different markets. With the CTS indicator, you can signal in different ways. This indicato
Технический индикатор Universal Oscillator является комбинацией торговых сигналов самых популярных и широко используемых осцилляторов. Индикатор представлен гистограммами, а также линиями fast и slow MA, что позволяет расширить список получаемых торговых рекомендаций и работать как по тренду, так и в боковом движении рынка. Таким образом, гистограммы позволяют определить момент пробоя ценовых значений и движение в новой фазе рынка, а линии указывают на зоны перекупленности и перепроданности.  Ос
Volality Index Scalper
Lesedi Oliver Seilane
5 (1)
Volality Index scalper indicator  Meant for Volality pairs such as Volality 10, 25, 50, 75 and 100 The indicator works on all timeframes from the 1 minute to the monthly timeframe the indicator is non repaint the indicator has 3 entry settings 1 color change on zero cross 2 color change on slope change 3 color change on signal line cross Orange line is your sell signal Blue line is your buy signal.
Implements a channel based on the moving average indicator with improved functionality. Moving average, moving average (English Moving average, MA) is a general name for a family of functions, the values ​​of which at each point of determining the level of some average value of the original function for the previous period. The channel moves up and down relative to the moving average by a specified number of points. This indicator is suitable for those who are interested in the classic calcul
MACDivergence MTF MT5
Pavel Zamoshnikov
4 (5)
Advanced ideas of the popular MACD indicator: It detects and displays classic and reverse divergences (two methods of detecting divergences). It uses different color to highlight an uptrend and a downtrend. Two methods of determining a trend: а) MACD crosses the 0 level (classic signal); б) MACD crosses its own average (early signal). This is a multi-timeframe indicator: it can display MACD data from other timeframes. Two methods of drawing: classic histogram and line. It generates sound and vis
KT Renko Patterns MT5
KEENBASE SOFTWARE SOLUTIONS
KT Renko Patterns scans the Renko chart brick by brick to find some famous chart patterns that are frequently used by traders across the various financial markets. Compared to the time-based charts, patterns based trading is easier and more evident on Renko charts due to their uncluttered appearance. KT Renko Patterns features multiple Renko patterns, and many of these patterns are extensively explained in the book titled Profitable Trading with Renko Charts by Prashant Shah. A 100% automated
Noize Absorption Index - is the manual trading system that measures the difference of pressure between bears forces and bulls forces. Green line - is a noize free index that showing curent situation. Zero value of index shows totally choppy/flat market.Values above zero level shows how powerfull bullish wave is and values below zero measures bearish forces.Up arrow appears on bearish market when it's ready to reverse, dn arrow appears on weak bullish market, as a result of reverse expectation.
Tendencia Crash300
Ignacio Agustin Mene Franco
Professional Pack Crash 300 Indicators, On this occasion I present the trend indicator that is for the crash index 300 (Deriv Broker) The indicator consists of a strategy where trends are caught in periods of 15 minutes, very clearly the indicator shows the purchase marking the tip of red until the trend develops, and then mark the green point of purchase, it is very simple to use, It is recommended to use in that temporality since it serves to catch longer trends and increase profit, the indica
SolarTrade Suite Financial Indicator: Jupiter Market Indicator - La tua guida affidabile nel mondo dei mercati finanziari! Questo è un indicatore di tendenza che utilizza speciali algoritmi innovativi e avanzati per calcolare il suo valore e ha anche un design gradevole alla vista. È molto facile capire le letture di questo indicatore: colore blu - acquisto, rosso - vendita. Dai un'occhiata agli altri nostri prodotti della serie SolarTrade Suite in fondo alla descrizione. Vuoi navigare con
Superb Trend
Sukhvinder Singh
Get the best out of your forex trading experience with our Superb Trend   indicator! Our revolutionary technology helps you make smarter and more successful trades, no matter your skill level. With a simple and intuitive interface, you'll be able to analyze trends and make wiser decisions in no time. Stop gambling with your money; start leveraging our Superb Trend Indicator to outperform the market! Trend Signals: Bullish trend will show as Green line. Bearish trend will show as Red line. Supe
Cumulative delta indicator As most traders believe, the price moves under the pressure of market buying or selling. When someone redeems an offer standing in the cup, the deal is a "buy". If someone pours into the bid standing in the cup - the deal goes with the direction of "sale". The delta is the difference between purchases and sales. A cumulative delta - the difference between the cumulative sum of purchases and sales for a certain period of time. It allows you to see who is currently contr
OPTMIZE EA BEFORE BACKTEST AND USE. United States Stock Market Index US500 trades the 5 minute charts.  The EA uses RSI and Stochastics  for entries and ATR for exits.  The building period was  From 2021-03-19 to 2022-08-18. Continually optimize the EA to find best settings and don't forget to account for spreads and slippage in optimization .  The EA does not use martingale and has a sl and tp on each trade with a fixed lot input.  Try it out in the back test, optimize for settings.  Risk Dis
Questo indicatore multi time frame e multi simbolo avvisa sui cambiamenti di colore di Heiken Ashi Smoothed. Come bonus, può anche eseguire la scansione dei cambiamenti di colore (tendenza) della media mobile dello scafo. Combinato con le tue regole e tecniche, questo indicatore ti permetterà di creare (o migliorare) il tuo potente sistema. Caratteristiche Può monitorare contemporaneamente tutti i simboli visibili nella finestra Market Watch. Applica l'indicatore a un solo grafico e monitora is
MACD indicator, first indicator, loading 3 cycles, 3 windows, 5-minute, 1-hour, 1-day chart, accurate comparison ,Can be used in conjunction with my EMA metrics, The other moving average indicator I sell on MQL5 can prevent volatile market conditions, The signal line needs to be fixed after the color changes, and then the signal direction can be confirmed,For example, for a 5-minute chart, you need to wait until the next 5 minutes to confirm that the signal direction is good
This Indicator enhances the default Relative Strength Index (RSI) by introducing several improvements. First, it visually highlights overbought and oversold regions by changing the RSI color from white to red. Second, it includes additional reference lines at 20, 40, 50, 60, and 80, providing a clearer framework for assessing RSI values. The most notable feature is the use of the middle 50-line to indicate the current market cycle. The color of the 50-line dynamically reflects the cycle: green f
The Jackson Auto Candlestick Pattern . It a powerful price action tool which auto detect and alert a hided powerful candlestick patterns . It came with few different chart skins. You can use this indicator alone to make profit, but it powerful when you combine it with trendlines, You can download The Jackson Auto Trendlines for free Link : UCRW695l9Wgg2ucnnf5DL5Vw  List of Candlestick Pattern it detect   1. Bullish & Bearish Engulfing's 2. Top and Bottom Tweezer 3. Bullish and Bearish Harams 4.
Introduction The "Two Moving Average Crossover" indicator for MetaTrader 5 (MT5) is a technical analysis tool that displays two moving averages and notifies when the moving averages cross each other. The indicator calculates and plots two moving averages, one of which is faster and the other is slower. When the faster moving average crosses above the slower moving average, it is considered a bullish signal, indicating a potential trend reversal or the start of a new uptrend. Conversely, when th
The Hull  Butterfly  Oscillator (HBO) is an oscillator constructed from the difference between a regular  Hull Moving Average  (  HMA  ) and another with coefficients flipped horizontally . Levels are obtained from cumulative means of the absolute value of the oscillator. These are used to return dots indicating potential reversal points . This indicator draw line in separate window, plus blue dot (for buy signal) when hull oscillator is peak and red when sell signal. It  also includes integrate
PipFinite Trend PRO MT5
Karlo Wilson Vendiola
4.84 (551)
Breakthrough Solution For Trend Trading And Filtering With All Important Features Built Inside One Tool! Trend PRO's smart algorithm detects the trend, filters out market noise and gives entry signals with exit levels. The new features with enhanced rules for statistical calculation improved the overall performance of this indicator. Important Information Revealed Maximize the potential of Trend Pro, please visit www.mql5.com/en/blogs/post/713938 The Powerful Expert Advisor Version Automatin
Price Breakout pattern Scanner is the automatic scanner for traders and investors. It can detect following patterns automatically from your chart. Head and Shoulder - Common tradable pattern. Reverse Head and Shoulder - This pattern is the reverse formation of the Head and Shoulder. Double Top - When the price hits resistance level twice and decline toward the support level, the trader can anticipate sudden bearish breakout through the support level. Double Bottom - The double bottom pattern is
The Dual MACD & Stochastic Expert Advisor (EA)  is a fully automated trading system that utilizes two  MACD (Moving Average Convergence Divergence) indicators along with the  Stochastic Oscillator  to identify high-probability trading opportunities. By combining trend confirmation from MACD with momentum analysis from Stochastic, this EA provides precise entry and exit points for optimized trading performance. Key Features: • Dual MACD Strategy – Uses two MACD indicators with different setting
Visual EMA PriceSync Indicator
AL MOOSAWI ABDULLAH JAFFER BAQER
Visual EMA PriceSync Indicator Price: $65 Discover a cutting-edge trading indicator designed to synchronize price action with EMA (Exponential Moving Average) trends. The Visual EMA PriceSync Indicator is your ultimate tool for identifying precise market entry and exit points, making it an essential addition to any trader’s arsenal. What does it do? The indicator detects crossover signals between the price and EMA, which signify potential trend reversals or market corrections. These sign
Your Trend Friend
Luigi Nunes Labigalini
5 (1)
The trend is your friend! Look at the color of the indicator and trade on that direction. It does not  repaint. After each candle is closed, that's the color of the trend. You can focus on shorter faster trends or major trends, just test what's most suitable for the symbol and timeframe you trade. Simply change the "Length" parameter and the indicator will automatically adapt. You can also change the color, thickness and style of the lines. Download and give it a try! There are big movements w
Fibonacci Auto
Makarii Gubaydullin
Automatically plots Fibo levels, based on the High & Low prices from the specified time frame Multiple bars   may be united: e.g. you can get a Fibo based on the 10-days Highs and Lows My   #1   Utility : 65+ features, including this indicator  |   Contact me  for any questions  |    MT4 version Helps to see potential reversal levels; Patterns formed at the Fibo levels tend to be stronger; Significantly   reduces   the   time   spent   on   manual  plotting ; Settings: Timeframe to calculate the
This is a smooth and responsive accelerometer which reveals the market trend and strength. [ Installation Guide | Update Guide | Troubleshooting | FAQ | All Products ] Two moving averages indicate trend direction The histogram represents strength of the price movement It draws buy and sell zones as colored vertical lines Should be used as a confirmation indicator Customizable line widths and colors It implements alerts of all kinds This indicator is similar to MACD but aims to react faster to
DYJ SuperGamingTrend EA funziona sulla base dell'indicatore DYJ ChameleonTrend . Utilizza il colore della linea di tendenza camaleonte dyj per controllare il segnale di apertura della posizione lungo e breve. E collabora con Ma veloce, Ma media e Ma lenta per filtrare i falsi segnali. EA utilizza la strategia gmaing per correggere le perdite causate dall'apertura di falsi segnali, rendendole redditizie e i profitti regolabili. Se si desidera visualizzare la curva di cambio colore di tendenza de
Owl Smart Levels MT5
Sergey Ermolov
4.07 (28)
Versione MT4  |  FAQ L' indicatore Owl Smart Levels è un sistema di trading completo all'interno dell'unico indicatore che include strumenti di analisi di mercato popolari come i frattali avanzati di Bill Williams , Valable ZigZag che costruisce la corretta struttura a onde del mercato, e i livelli di Fibonacci che segnano i livelli esatti di entrata nel mercato e luoghi per prendere profitti. Descrizione dettagliata della strategia Istruzioni per lavorare con l'indicatore Consulente-assistente
MACD 2 Lines
Markus Paminger
MACD with fast and slow EMA. Moving average convergence divergence (MACD) is a trend-following momentum indicator that shows the relationship between two moving averages of a security's price . The MACD is calculated by subtracting the fast-period exponential moving average (EMA) from the slow-period EMA. Setup options: Fast EMA period Slow EMA period Signal EMA period Applied price Indicator window height Color MACD Color Signal Color Histogram
Bear Bull
Ignacio Agustin Mene Franco
Bear Bull! It is an indicator that marks with Heikin Ashi candles but modified, the sales and purchases long and short trend! with 2 colors green marks the purchase, purple marks the sale, works for any type of temporality, works for forex markets and synthetic indices! ideal for any pair, it also works for crypto pairs, Good profit! World Investor - World Inversor - 
Gli utenti di questo prodotto hanno anche acquistato
Trend Screener Pro MT5
STE S.S.COMPANY
4.89 (74)
Indicatore di tendenza, soluzione unica rivoluzionaria per il trading di tendenze e il filtraggio con tutte le importanti funzionalità di tendenza integrate in un unico strumento! È un indicatore multi-timeframe e multi-valuta al 100% non ridipingibile che può essere utilizzato su tutti i simboli/strumenti: forex, materie prime, criptovalute, indici e azioni. Trend Screener è un indicatore di tendenza che segue un indicatore efficiente che fornisce segnali di tendenza a freccia con punti nel gra
Golden Trend Indicator MT5
Noha Mohamed Fathy Younes Badr
4.88 (16)
Golden Trend indicator  is The best indicator for predicting trend movement this indicator never lags and never repaints and never back paints    and give  arrow buy and sell    before the candle appear  and it will help you and  will make your trading decisions clearer its work on all currencies and  gold and crypto and all time frame This unique  indicator uses very secret algorithms to catch the  trends, so you can trade using this indicator and see the trend clear on charts  manual guide and
FX Levels MT5
Daniel Stein
5 (3)
FX Levels: Supporti e Resistenze di Precisione Eccezionale per Tutti i Mercati Panoramica Rapida Cercate un modo affidabile per individuare livelli di supporto e resistenza in ogni mercato—coppie di valute, indici, azioni o materie prime? FX Levels fonde il metodo tradizionale “Lighthouse” con un approccio dinamico all’avanguardia, offrendo una precisione quasi universale. Basato sulla nostra esperienza reale con i broker e su aggiornamenti automatici giornalieri più quelli in tempo reale, FX
FX Volume MT5
Daniel Stein
4.82 (17)
FX Volume: Scopri il Vero Sentimento di Mercato dalla Prospettiva di un Broker Panoramica Rapida Vuoi portare la tua strategia di trading a un livello superiore? FX Volume ti offre informazioni in tempo reale su come i trader retail e i broker sono posizionati—molto prima che compaiano report in ritardo come il COT. Che tu miri a guadagni costanti o desideri semplicemente un vantaggio più solido sui mercati, FX Volume ti aiuta a individuare grandi squilibri, confermare i breakout e perfezionar
IX Power MT5
Daniel Stein
4.83 (6)
IX Power: Scopri approfondimenti di mercato per indici, materie prime, criptovalute e forex Panoramica IX Power è uno strumento versatile progettato per analizzare la forza di indici, materie prime, criptovalute e simboli forex. Mentre FX Power offre la massima precisione per le coppie di valute utilizzando i dati di tutte le coppie disponibili, IX Power si concentra esclusivamente sui dati di mercato del simbolo sottostante. Questo rende IX Power una scelta eccellente per mercati non correlat
FX Power MT5 NG
Daniel Stein
5 (11)
FX Power: Analizza la Forza delle Valute per Decisioni di Trading Più Intelligenti Panoramica FX Power è lo strumento essenziale per comprendere la reale forza delle principali valute e dell'oro in qualsiasi condizione di mercato. Identificando le valute forti da comprare e quelle deboli da vendere, FX Power semplifica le decisioni di trading e rivela opportunità ad alta probabilità. Che tu segua le tendenze o anticipi inversioni utilizzando valori estremi di Delta, questo strumento si adatta
CBT Quantum Maverick Sistema di Trading Binario ad Alta Efficienza CBT Quantum Maverick è un sistema di trading binario ad alte prestazioni progettato per trader che cercano precisione, semplicità e disciplina. Non è necessaria alcuna personalizzazione: il sistema è ottimizzato per fornire risultati efficaci fin dall'inizio. Con un po' di pratica, i segnali possono essere facilmente compresi. Caratteristiche principali: Precisione dei Segnali: Segnali di trading basati sulla candela attuale,
TPSproTREND PrO MT5
Roman Podpora
4.69 (16)
TPSpro TREND PRO   è un indicatore di tendenza che analizza automaticamente il mercato, fornisce informazioni sulla tendenza e sui rispettivi cambiamenti e fornisce segnali per entrare nelle operazioni senza ridisegnare. L'indicatore utilizza ciascuna candela e la analizza separatamente. Si riferisce a vari shock al rialzo o al ribasso. Punto di ingresso preciso per il trading di valute, criptovalute, metalli, azioni e indici! Versione MT5                   Descrizione completa dell'indicatore  
FX Dynamic: Monitora volatilità e trend con un’analisi ATR personalizzabile Panoramica FX Dynamic è uno strumento potente che sfrutta i calcoli di Average True Range (ATR) per fornire ai trader informazioni impareggiabili sulla volatilità, sia giornaliera che intraday. Impostando soglie di volatilità chiare—ad esempio 80%, 100%, 130%—puoi individuare rapidamente opportunità di profitto o ricevere avvisi quando il mercato supera i range abituali. FX Dynamic si adatta al fuso orario del tuo brok
Top indicator for MT5   providing accurate signals to enter a trade without repainting! It can be applied to any financial assets:   forex, cryptocurrencies, metals, stocks, indices .  Watch  the video  (6:22) with an example of processing only one signal that paid off the indicator! MT4 version is here It will provide pretty accurate trading signals and tell you when it's best to open a trade and close it. Most traders improve their trading results during the first trading week with the help of
Questo cruscotto mostra gli ultimi   pattern armonici   disponibili per i simboli selezionati, in modo da risparmiare tempo ed essere più efficienti /   versione MT4 . Indicatore gratuito:   Basic Harmonic Pattern Colonne dell'indicatore Symbol :   vengono visualizzati i simboli selezionati Trend:   rialzista o ribassista Pattern:   tipo di pattern (gartley, butterfly, bat, crab, shark, cypher o ABCD) Entry:   prezzo di ingresso SL:   prezzo di stop loss TP1:   1 prezzo di take profit TP2:
Matrix Arrow Indicator MT5
Juvenille Emperor Limited
5 (13)
Matrix Arrow Indicator MT5   è un trend unico 10 in 1 che segue un indicatore multi-timeframe al   100% non ridipinto   che può essere utilizzato su tutti i simboli/strumenti:   forex ,   materie prime ,   criptovalute ,   indici ,   azioni .  Matrix Arrow Indicator MT5  determinerà la tendenza attuale nelle sue fasi iniziali, raccogliendo informazioni e dati da un massimo di 10 indicatori standard, che sono: Indice di movimento direzionale medio (ADX) Indice del canale delle materie prime (CCI
Gold Stuff mt5
Vasiliy Strukov
4.92 (173)
Gold Stuff mt5 è un indicatore di tendenza progettato specificamente per l'oro e può essere utilizzato anche su qualsiasi strumento finanziario. L'indicatore non ridisegna e non è in ritardo. Periodo consigliato H1. Contattami subito dopo l'acquisto per avere le impostazioni e un bonus personale!   I risultati in tempo reale possono essere visualizzati qui.  Puoi ottenere una copia gratuita del nostro indicatore Strong Support e Trend Scanner, per favore scrivi in ​​privato. M   IMPOSTAZIONI
TPSpro RFI Levels MT5
Roman Podpora
4.53 (19)
ISTRUZIONI       RUS   -   INGLESE       Si   consiglia di utilizzare con un indicatore       -       TPSpro   TENDENZA PRO -   Versione MT4         Un elemento chiave nel trading sono le zone o i livelli da cui vengono prese le decisioni di acquisto o vendita di uno strumento di trading. Nonostante i tentativi dei principali attori di nascondere la loro presenza sul mercato, lasciano inevitabilmente delle tracce. Il nostro compito era imparare a identificare queste tracce e interpretarle corre
Innanzitutto, vale la pena sottolineare che questo Strumento di Trading è un Indicatore Non-Ridipingente, Non-Ridisegnante e Non-Laggante, il che lo rende ideale per il trading professionale. Corso online, manuale utente e demo. L'Indicatore Smart Price Action Concepts è uno strumento molto potente sia per i nuovi che per i trader esperti. Racchiude più di 20 utili indicatori in uno solo, combinando idee di trading avanzate come l'Analisi del Trader del Circolo Interno e le Strategie di Tradin
Gartley Hunter Multi
Siarhei Vashchylka
5 (9)
Gartley Hunter Multi - An indicator for searching for harmonic patterns simultaneously on dozens of trading instruments and on all possible timeframes. Manual (Be sure to read before purchasing) | Version for MT4 Advantages 1. Patterns: Gartley, Butterfly, Shark, Crab. Bat, Alternate Bat, Deep Crab, Cypher 2. Simultaneous search for patterns on dozens of trading instruments and on all possible timeframes 3. Search for patterns of all possible sizes. From the smallest to the largest 4. All fou
Bill Williams Advanced
Siarhei Vashchylka
5 (9)
Bill Williams Advanced is designed for automatic chart analysis using Bill Williams' "Profitunity" system. The indicator analyzes four timeframes at once. Manual (Be sure to read before purchasing) Advantages 1. Automatically analyzes the chart using the "Profitunity" system of Bill Williams. The found signals are placed in a table in the corner of the screen. 2. Equipped with a trend filter based on the Alligator indicator. Most of the system signals are recommended to be used only according t
Support And Resistance Screener è in un indicatore di livello per MetaTrader che fornisce più strumenti all'interno di un indicatore. Gli strumenti disponibili sono: 1. Screener della struttura del mercato. 2. Zona di ritiro rialzista. 3. Zona di ritiro ribassista. 4. Punti pivot giornalieri 5. Punti pivot settimanali 6. Punti pivot mensili 7. Forte supporto e resistenza basati sul modello e sul volume armonici. 8. Zone a livello di banca. OFFERTA A TEMPO LIMITATO: il supporto HV e l'indicatore
RelicusRoad Pro MT5
Relicus LLC
4.78 (18)
Ora $ 147 (aumentando a $ 499 dopo alcuni aggiornamenti) - account illimitati (PC o MAC) Manuale utente di RelicusRoad + Video di formazione + Accesso al gruppo Discord privato + Stato VIP UN NUOVO MODO DI GUARDARE IL MERCATO RelicusRoad è l'indicatore di trading più potente al mondo per forex, futures, criptovalute, azioni e indici, fornendo ai trader tutte le informazioni e gli strumenti di cui hanno bisogno per rimanere redditizi. Forniamo analisi tecniche e piani di trading per aiutare og
FxaccurateLS
Shiv Raj Kumawat
WHY IS OUR FXACCCURATE LS MT5 THE PROFITABLE ? PROTECT YOUR CAPITAL WITH RISK MANAGEMENT Gives entry, stop and target levels from time to time. It finds Trading opportunities by analyzing what the price is doing during established trends. POWERFUL INDICATOR FOR A RELIABLE STRATEGIES We have made these indicators with a lot of years of hard work. It is made at a very advanced level. Established trends provide dozens of trading opportunities, but most trend indicators completely ignore them! The
Quantum TrendPulse
Bogdan Ion Puscasu
5 (13)
Ecco   Quantum TrendPulse   , lo strumento di trading definitivo che combina la potenza di   SuperTrend   ,   RSI   e   Stocastico   in un unico indicatore completo per massimizzare il tuo potenziale di trading. Progettato per i trader che cercano precisione ed efficienza, questo indicatore ti aiuta a identificare con sicurezza le tendenze di mercato, i cambiamenti di momentum e i punti di entrata e uscita ottimali. Caratteristiche principali: Integrazione SuperTrend:   segui facilmente l'andame
Atomic Analyst MT5
Issam Kassas
4.32 (19)
Innanzitutto, vale la pena sottolineare che questo indicatore di trading non è repaint, non è ridisegno e non presenta ritardi, il che lo rende ideale sia per il trading manuale che per quello automatico. Manuale utente: impostazioni, input e strategia. L'Analista Atomico è un indicatore di azione del prezzo PA che utilizza la forza e il momentum del prezzo per trovare un miglior vantaggio sul mercato. Dotato di filtri avanzati che aiutano a rimuovere rumori e segnali falsi, e aumentare il pote
TW Trend Scalper Indicator: The TW Scalper Shoot ti offre un'esperienza di trading unica utilizzando le ultime strategie di trading e la tecnologia dell'intelligenza artificiale. Questo prodotto soddisfa le diverse esigenze dei trader scalper fornendo due categorie distinte di segnali: Testa questo prodotto eccezionale oggi e inizia la tua esperienza unica per diventare un scalper di tendenze. Inoltre, ricevi un prodotto del valore di 37 $ come regalo. Categorie di segnali: 1. Segnali a lu
L'indicatore Quadrato di Gann è uno strumento potente di analisi di mercato basato sull'articolo "Formula Matematica per le Previsioni di Mercato" scritto da W.D. Gann. Questo strumento utilizza concetti matematici e teorie di Gann per effettuare un'analisi precisa del mercato. Utilizza i quadrati di 144, 90, 52 e anche il quadrato di 9. Inoltre, integra il metodo del  per il quadrato di 9 e la sua relazione con canali e modelli stellari di quel quadrato. Manuale Utente e Applicazione: Prima di
ICT, SMC, SMART MONEY CONCEPTS, SMART MONEY, Smart Money Concept, Support and Resistance, Trend Analysis, Price Action, Market Structure, Order Blocks, BOS/CHoCH,   Breaker Blocks ,  Momentum Shift,   Supply&Demand Zone/Order Blocks , Strong Imbalance,   HH/LL/HL/LH,    Fair Value Gap, FVG,  Premium  &   Discount   Zones, Fibonacci Retracement, OTE, Buy Side Liquidity, Sell Side Liquidity, BSL/SSL Taken, Equal Highs & Lows, MTF Dashboard, Multiple Time Frame, BigBar, HTF OB, HTF Market Structure
- Lifetime update free -   Real price is 80$   - 25% Discount ( It is 59$ now ) Contact me for instruction, any questions! Related Product:  Gold Trade Expert MT5 - Non-repaint - I just sell my products in Elif Kaya Profile, any other websites are stolen old versions, So no any new updates or support. Introduction The breakout and retest strategy is traded support and resistance levels. it involves price breaking through a previous level.  The break and retest strategy is designed to help trade
BookMap HeatMap
Roberto Spadim
1 (2)
This Indicator creates a heatmap based on depth of market of the current symbol or another symbol. Other symbol is useful when you trade futures market and a contract has 'mini' and 'full' split. For example, in Brazil (B3 - BMF&Bovespa), WDO and DOL are future Forex contract of BRL/USD (where 1 DOL = 5 WDO) and big banks work mostly with DOL (where liquidity is important). Please use with M1 timeframe , objects are too small to be displayed at higher timeframes (MT5 limit). The number of level
Berma Bands
Muhammad Elbermawi
5 (3)
L'indicatore Berma Bands (BBs) è uno strumento prezioso per i trader che cercano di identificare e capitalizzare i trend di mercato. Analizzando la relazione tra il prezzo e le BBs, i trader possono discernere se un mercato è in una fase di trend o di range. Visita il [ Berma Home Blog ] per saperne di più. Le Berma Bands sono composte da tre linee distinte: la Upper Berma Band, la Middle Berma Band e la Lower Berma Band. Queste linee sono tracciate attorno al prezzo, creando una rappresentazion
Presentazione       Quantum Breakout PRO   , l'innovativo indicatore MQL5 che sta trasformando il modo in cui scambi le zone di breakout! Sviluppato da un team di trader esperti con un'esperienza di trading di oltre 13 anni,       Quantum Breakout PRO       è progettato per spingere il tuo viaggio di trading a nuovi livelli con la sua strategia innovativa e dinamica della zona di breakout. Quantum Breakout Indicator ti fornirà frecce di segnalazione sulle zone di breakout con 5 zone target di
Easy Breakout MT5
Mohamed Hassan
5 (3)
After your purchase, feel free to contact me for more details on how to receive a bonus indicator called VFI, which pairs perfectly with Easy Breakout for enhanced confluence!     Easy Breakout MT5   is a powerful price action trading system built on one of the most popular and widely trusted strategies among traders: the   Breakout strategy ! This indicator delivers crystal-clear Buy and Sell signals based on breakouts from key support and resistance zones. Unlike typical breakout indicators
Altri dall’autore
Introduzione Si tratta di un EA pullback progettato per rilevare divergenze di tendenza, che corrisponde al primo tipo di punti di acquisto e vendita nella teoria "Zhan Zhong Shuo Chan". Con un fattore di profitto eccezionalmente elevato, questo EA offre una redditività costante a lungo termine. Utilizza il grid trading dinamico, che gli consente di adattarsi perfettamente alle varie condizioni di mercato. Nuovo prezzo promozionale EA: $ 99 → $ 149 Segnale in tempo reale https://www.mql5.com/i
Smart Peak Bottom
Xiaoyu Huang
5 (2)
Questo è un chiaro indicatore per giudicare massimi e minimi e funziona bene per il mercato oscillante. Prezzo promozionale 49$ → 59$ caratteristiche bravo a giudicare alti e bassi Nessun ridisegno, nessuna deriva Calcolo veloce, nessun ritardo Ricca modalità di promemoria È possibile regolare più parametri e colori parametro "======== Principale ========" HighLowPeriod1 = 9 HighLowPeriod2 = 60 HighLowPeriod3 = 34 HighLowEMAPeriod = 4 MASignalPeriod = 5 "======== Notifica ========" UseAlertN
Gold Digger AI
Xiaoyu Huang
5 (4)
Questo è un EA di trading di oro stabile e redditizio a lungo termine, che utilizza indicatori tecnici tradizionali e utilizza l'IA per EA adattivo. Nuovo prezzo promozionale EA: $ 199   →   $ 249 Caratteristica un ordine alla volta stop loss fisso adattivo negoziazione notturna Ottimizza lo slittamento filtro notizie Adatto per passare FTMO, DARWINEX Zero Può essere utilizzato con altri EA Programmazione orientata agli oggetti, il framework del programma è stato testato per 5 anni Segnale http
introdurre Questo è un EA per il trading notturno, tra 21: 00-22: 00 Le offerte fisse a lungo termine sono redditizie Scambia solo un ordine alla volta e non causerà una grande perdita Imposta stop loss e take profit per ogni ordine, non utilizzare grid, Martin o altra gestione di fondi ad alto rischio Può essere utilizzato per più valute contemporaneamente Imposta automaticamente il fuso orario per impostazione predefinita caratteristica Grafico di trading: M15 Valute negoziabili: EURUSD,GBPSU
EEVCC Hedge Prezzo della promozione: $59 Attivazione: 10 introduzione Questo è un EA di trading hedge grid a due vie (acquista e vendi allo stesso tempo) Le offerte fisse a lungo termine sono redditizie Può essere utilizzato in più valute contemporaneamente Metodo di calcolo del profitto sicuro caratteristica Grafico di trading: H1 Valuta consigliata: EURGBP, EURUSD Deposito minimo: 3000 USD, consigliato 10000 USD, 100 USD per i conti cent Broker consigliati: RofoForex, Exness e altre piattaform
Quick View
Xiaoyu Huang
1 day Promotional price: $49 Activation: 30 10 days promotional price: $59 activation: 20 Introduction Quick View Quickly check the profitability for a period of time and display the statistics Quickly filter historical transactions and make statistics based on time, magic number, currency, and comments Statistics include Net Profit, LotTotal, Profit Factor, Short Trades (win %), Long Trades (win %), Average Profit Trade, etc. Refresh statistical data in real time Calculation time is less
Introduction This is an indicator of daily profitability Characteristic Statistics can be based on currency, magic number, and notes Statistics can be based on time Available for all currencies, all periods There are white and black themes Reverse sort The refresh rate can be adjusted You can set the refresh time to the latest Parameter nD                     =  30;                                     // Number of days StartTime          =  D'2021.06.01 00:00:00';       //  StartTime EndTime 
Sistema semiautomatico Martin introdurre Questo strumento viene utilizzato per il trading semiautomatico di Martin, fai clic sul pannello per effettuare un ordine e l'EA gestirà la posizione Basta decidere la direzione della transazione e lasciare il resto alla direzione di EA Martin automatico, aggiungi magazzino in base alla griglia impostata, puoi anche disabilitare questa funzione Liquidazione con un clic Una funzione di blocco dei tasti controllo del tempo Avviso sonoro caratteristica
Introduce This is a trading assistant, information panel indicators, aggregate currency statistics, account statistics, position information, server and local time, currency strength, K-line remaining time, support and resistance lines, server time offset, currency fluctuations Rate and other functions. Can be used for all types of accounts and currencies. Excellent performance, very few resources You can customize the position, color, font size Any module can be individually displayed or disab
CZSC Indice di tipo frattale Caratteristiche: Ha svolto un'elaborazione approfondita della relazione di inclusione È conveniente utilizzare la chiamata EA per giudicare se si tratta di una classificazione top-bottom e lo stato in "Teaching You to Stock 93: The Relationship between the Two Tables and the Inside of the Trend Structure 2" Mostra la classificazione dall'alto verso il basso con le frecce Mostra possibili penne in diversi colori La relazione di inclusione di due linee K adiacen
Questa libreria viene utilizzata per ordinare gli array di chiavi e valori, spesso abbiamo bisogno di ordinare i valori. come nel linguaggio Python sorted(key_value.items(), key = lambda kv:(kv[ 1 ], kv[ 0 ])) funzione di importazione Esempio di scenari di utilizzo 1. Gli ordini Grid EA sono ordinati in base al prezzo di apertura void SortedByOpenPride()   {    long     OrderTicketBuffer[];    double   OpenPriceBuffer[];    for ( int i = PositionsTotal ()- 1 ; i>= 0 ; i--)      {        if
King of Dragon Channel, Indicatore King of Dragon, Sistema King of Dragon, King of Dragon MT5, Indicatore classico King of Dragon, Sistema di scorrimento King of Dragon, Re del drago tutto in uno Il sistema di trading di canali King of Dragon, che è un classico sistema di trading di canali, molti utenti richiedono fortemente la versione MT5. Questo programma è stato ottimizzato per le prestazioni in più versioni ed è già un sistema relativamente fluido. 49$ → 59$ Zona rossa, trend long, solo l
Cet indicateur combine les indicateurs classiques MACD et Zigzag pour détecter la divergence entre le prix et les indicateurs. Il utilise également une technologie avancée d’intelligence artificielle (IA) pour détecter la validité des divergences. MACD est connu comme le « roi des indicateurs » et Zigzag est également un indicateur très utile. En combinant ces deux indicateurs, cet indicateur exploite les atouts des deux. La détection de divergence est un problème probabiliste. Souvent, les d
Indicatore di forza valutaria L’indicatore della forza valutaria è un potente strumento per identificare le tendenze. Confronta la forza e la debolezza di diverse valute e semplifica la ricerca delle coppie di valute di tendenza. Prezzo di vendita: $ 49 Caratteristiche Distingue efficacemente tra valute forti e deboli Identifica automaticamente le valute di tendenza Multi-orizzonte temporale Carica 28 coppie di valute Prestazioni ottimizzate Utilizzo dell'indicatore Valute forti: le valute
WuKong EA
Xiaoyu Huang
Questo è un EA di trading stabile e redditizio a lungo termine con un rischio molto basso. Utilizza indicatori tecnici tradizionali per EA adattivi. Questo EA è principalmente un'ottimizzazione dell'algoritmo piuttosto che un'ottimizzazione dei parametri. Ciò che perseguiamo è un profitto stabile a lungo termine. Fare soldi in modo stabile è la cosa più importante. Nuovo prezzo promozionale EA: $199   → $299 Caratteristiche Un ordine alla volta, nessuna Martingala, griglia Redditizio dopo ver
Presentazione di Chart Compare, il tuo strumento di sincronizzazione multi-grafico definitivo Ora in vendita a $ 39 (normalmente $ 59) Sincronizza senza problemi più grafici per informazioni immediate. Caratteristiche principali: Sincronizzazione rapidissima: la tecnologia basata sugli eventi garantisce aggiornamenti fluidi e immediati su tutti i grafici. Leggero ed efficiente: utilizzo minimo delle risorse di sistema per prestazioni ottimali. Confronti rapidi: confronta facilmente strumenti
Filtro:
Nessuna recensione
Rispondi alla recensione