KT MA Crossover MT5
- Indicatori
- KEENBASE SOFTWARE SOLUTIONS
- Versione: 1.5
- Aggiornato: 26 marzo 2022
- Attivazioni: 10
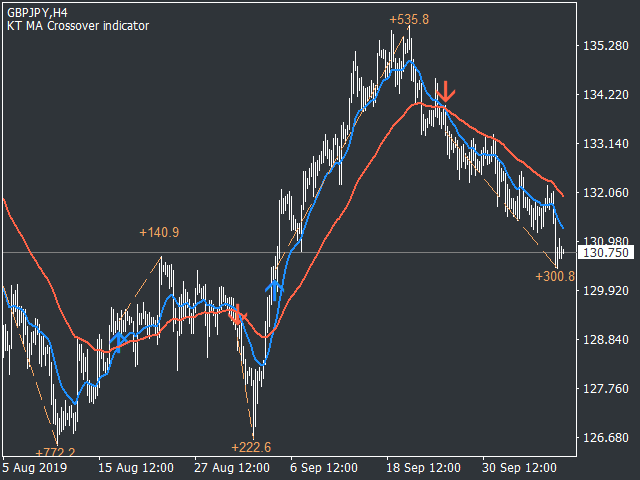
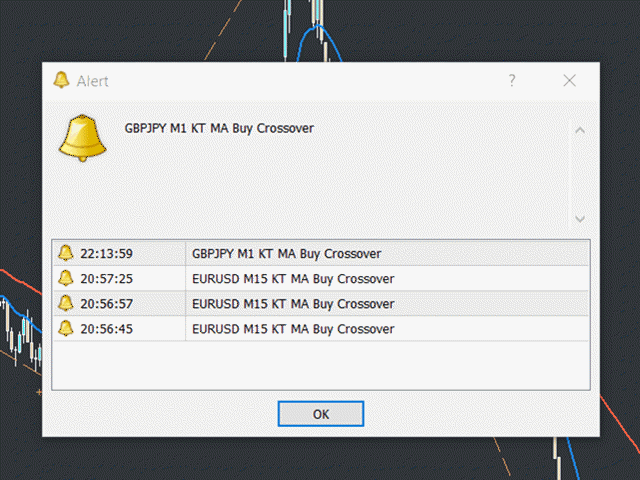
KT MA Crossover disegna frecce di acquisto e vendita in base all'incrocio delle medie mobili selezionate. Inoltre, genera gli avvisi appropriati e visualizza il valore MFE (Escursione Più Favorevole) per ogni segnale consecutivo.
L’incrocio delle medie mobili è una delle strategie più utilizzate dai trader di tutto il mondo. Di solito si basa su una media mobile veloce e una lenta per determinare segnali di ingresso in acquisto o vendita in base alla direzione dell’incrocio.
- Segnale di acquisto – quando la media mobile veloce incrocia quella lenta verso l’alto.
- Segnale di vendita – quando la media mobile veloce incrocia quella lenta verso il basso.
Funzionalità
- Ogni parametro delle medie mobili è completamente personalizzabile.
- Visualizza il valore MFE per ogni segnale generato.
- Indicatore leggero con un utilizzo minimo delle risorse.
- Include tutti gli avvisi di MetaTrader.
Svantaggi
Le medie mobili sono indicatori ritardati, poiché si basano sui dati storici. Durante le fasi di consolidamento, i segnali generati dagli incroci possono essere casuali e generare falsi segnali. Per utilizzarli in modo efficace, è necessario il buon senso del trader.
Parametri di input
- Barre storiche: Numero di barre utilizzate per il calcolo dei segnali.
- ----- Scegli il periodo e il metodo per calcolare le medie mobili veloce e lenta -----
- Mostra Medie Mobili: Mostra/Nascondi le medie mobili sul grafico (i segnali di incrocio rimangono attivi).
- Disegna Linea di Profitto: Mostra/Nascondi la linea MFE.
- Impostazioni Avvisi: autoesplicative