Supply and Demand Draw
- Utilità
- Jorge Delgado Segura
- Versione: 2.8
- Aggiornato: 11 novembre 2020
- Attivazioni: 5
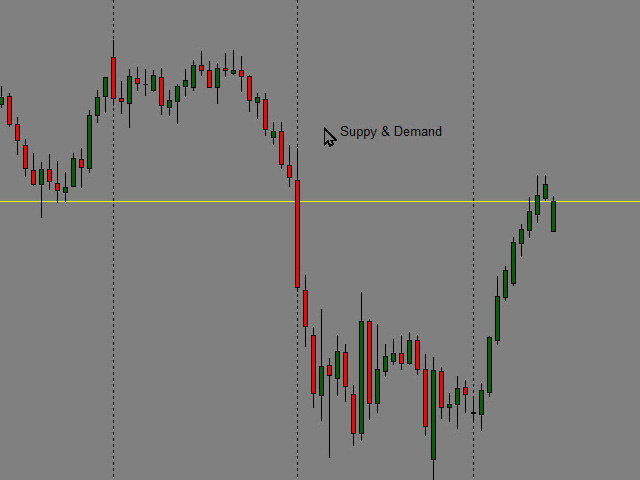
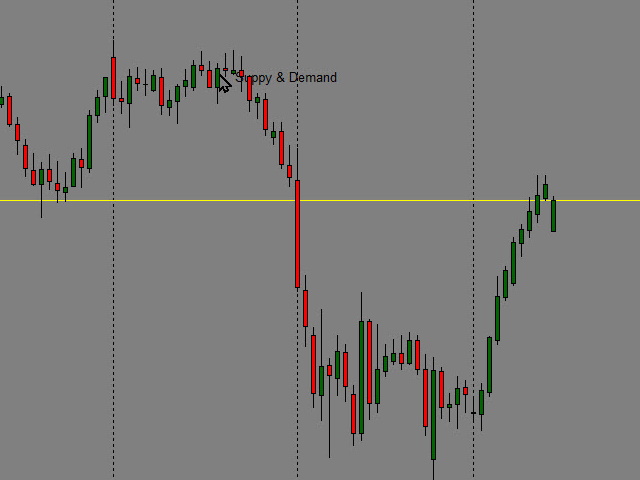
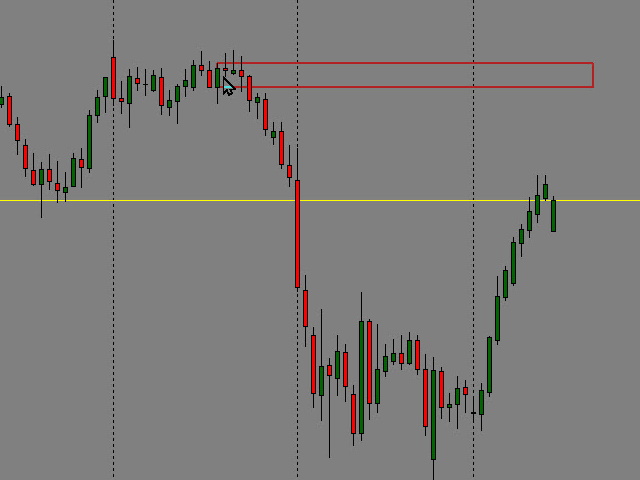
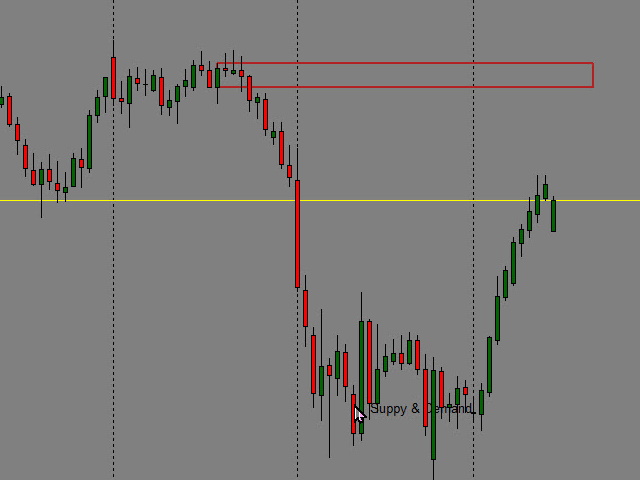
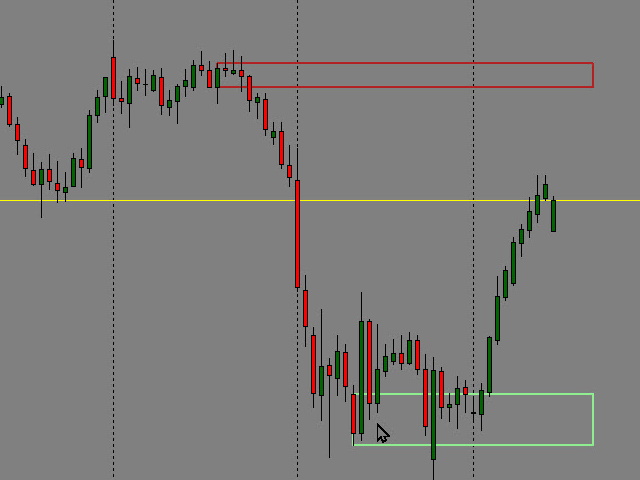
Just $30 for six months!!!. This will draw Supply & Demand zones just by clicking on a candle. It can also draw the mean threshold of the zone.
As a drawing tool, it is not active all the time after adding it to the chart.
Activate by pressing 's' twice on the keyboard within a second.
If activated but then decided not to draw, deactivate by pressing 's' once.
Box color depends if candle is above or below current price.
Settings/Inputs:
- Number of candles the box will extend to the right from the current / last candle.
- Color for bearish zone.
- Color for bullish zone.
- Instead of a filled box, draw it as an outlined box.
- Width of the line when drawing zone as an outlined box.
- Color for bearish zone, when drawing as an outlined box.
- Color for bullish zone, when drawing as an outlined box.
- Enable drawing a mid line at 50% of the zone.
- Style for the mid line.
- Width for the mid line.
- Color of the mid line.
If you prefer different colors on each timeframes, there is also 'Supply and Demand Draw MTF'.
IMPORTANT: Please remember the DEMO version will only work in the Strategy Tester
This utility is helpful for using with ICT® or BTMM®.
