History Pattern Search
- Indicatori
- Yevhenii Levchenko
- Versione: 3.12
- Aggiornato: 5 novembre 2022
- Attivazioni: 20
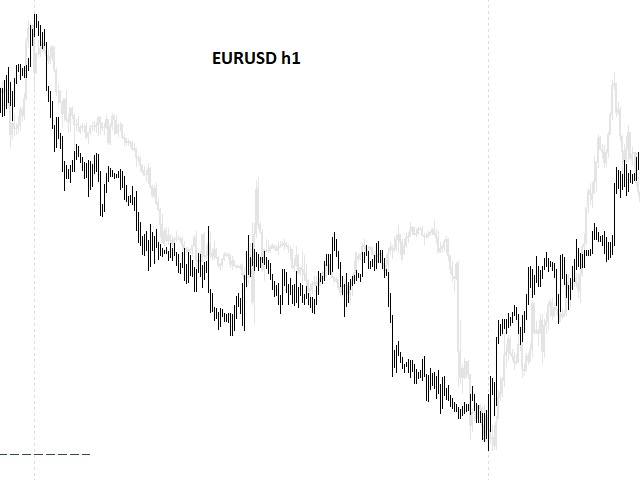
L'indicatore costruisce le quotazioni attuali, che possono essere confrontate con quelle storiche e su questa base fanno una previsione del movimento dei prezzi. L'indicatore ha un campo di testo per una rapida navigazione fino alla data desiderata.
Opzioni:
Simbolo - selezione del simbolo che visualizzerà l'indicatore;
SymbolPeriod - selezione del periodo da cui l'indicatore prenderà i dati;
IndicatorColor - colore dell'indicatore;
HorisontalShift - spostamento delle virgolette disegnate dall'indicatore per il numero di barre specificato;
Inverso - vero inverte le virgolette, falso - vista originale;
ChartVerticalShiftStep - spostamento del grafico in verticale (freccia su/giù sulla tastiera);
Poi ci sono le impostazioni del campo di testo, in cui puoi inserire la data, a cui puoi saltare immediatamente premendo 'invio'.