Currencies Strength Meter and Deviation
- Indicatori
- Mohamed yehia Osman
- Versione: 1.11
- Aggiornato: 3 settembre 2019
- Attivazioni: 5
:::: It is programmed to work on any M5 Chat windows !!
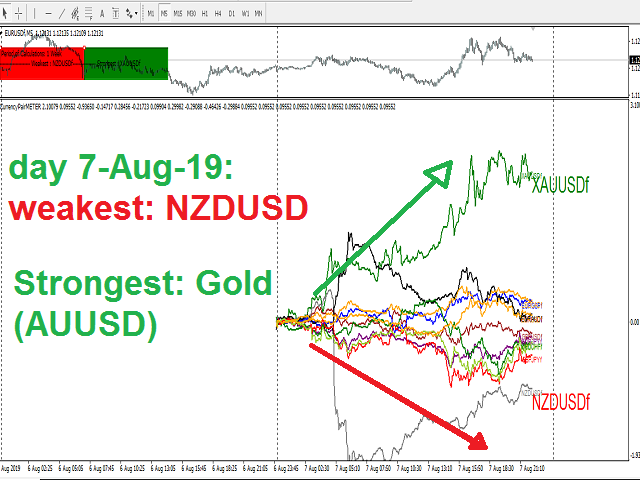
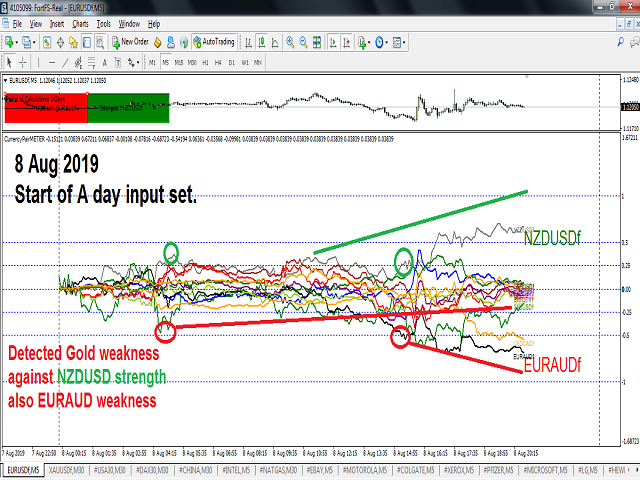
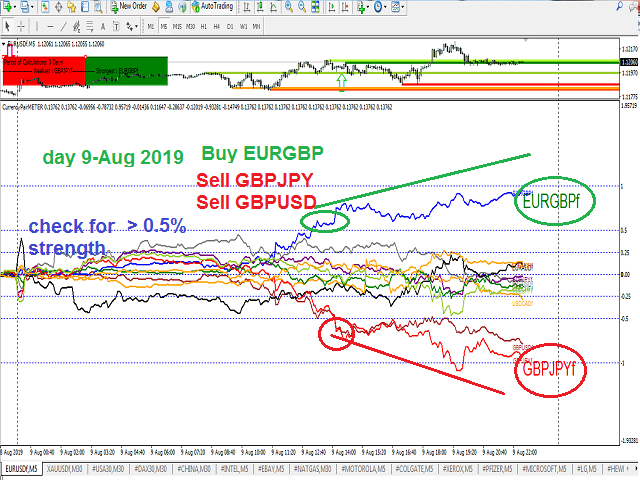
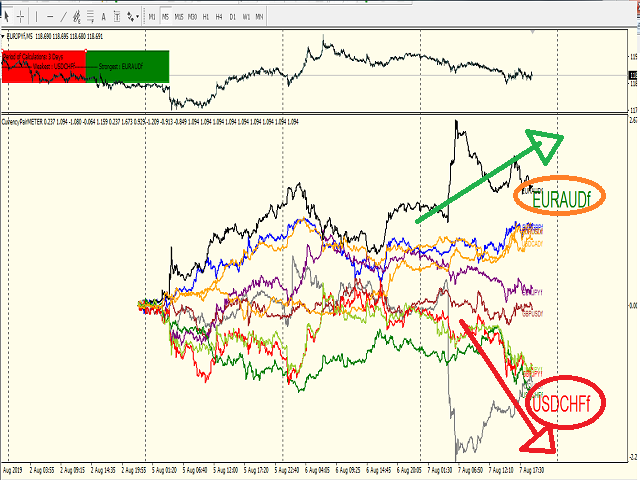
Used to determine the Strongest currency pairs and the Weakest pairs
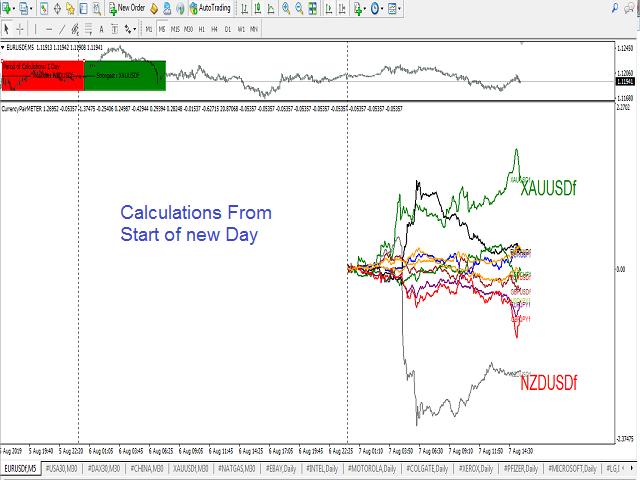
also detect the peak of deviation of currencies strength
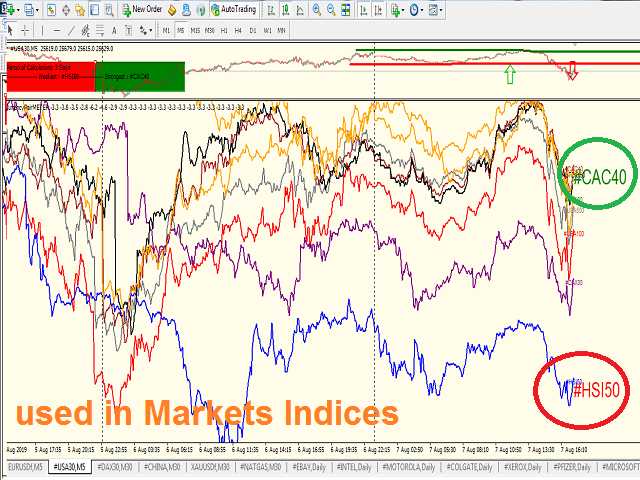
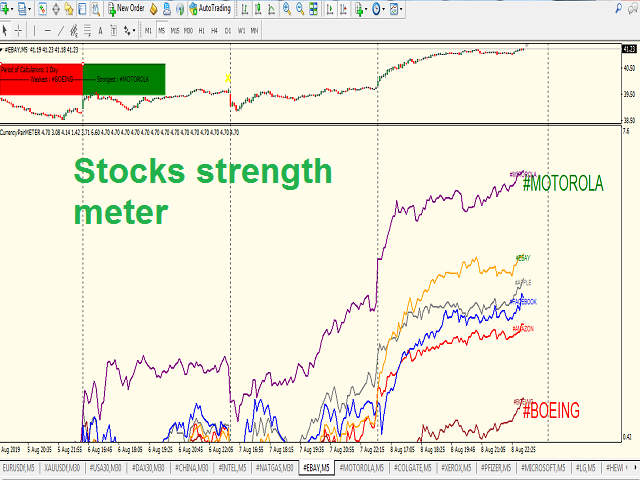
IT CAN BE USED FOR INDICES AND STOCKS TOO !!
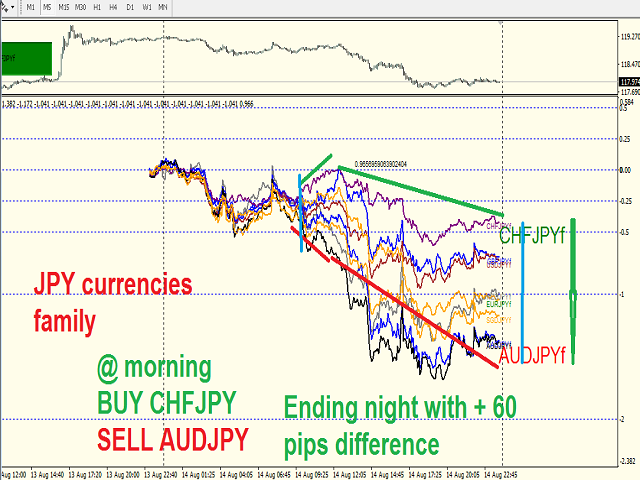
Strategy one : It can be used in to BUY Strongest pair and SELL Weakest one
Strategy two: It can be used on Daily basis to Hedge BUY Strongest pair with high % (ex: +1%) and BUY Weakest one with % lower(ex: -0.7%) the same with SELL
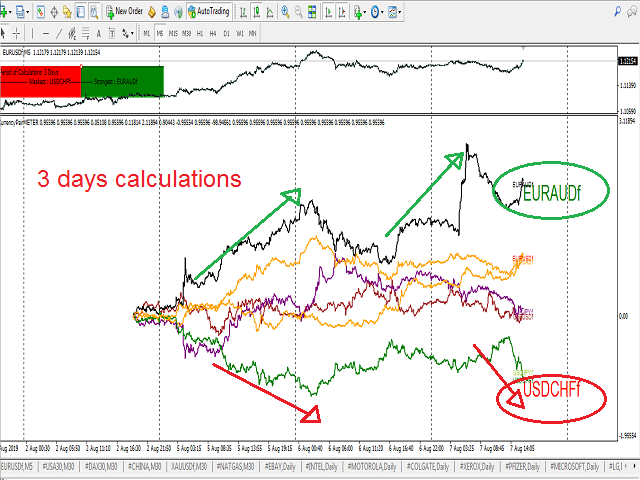
Strategy three: on 3days or above calculation : you can detect currencies strength lines crossing each other.
IMPORTANT NOTE: This is a multi-currencies mql4 indicator : so it may not be back-tested in strategy tester module unless you have downloaded all selected currencies data history
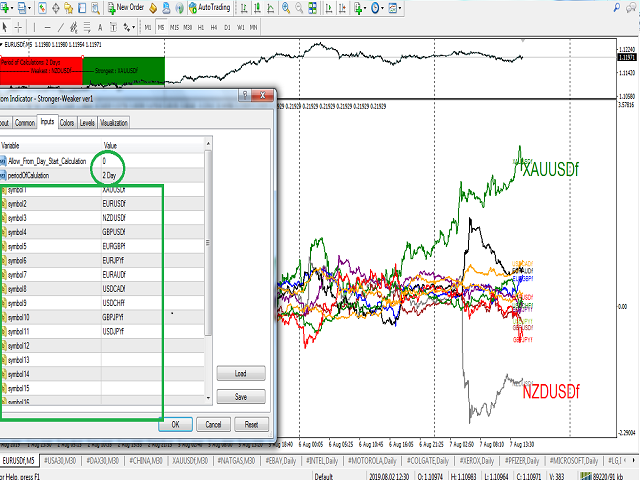
can combine up to 20 currencies pair
You can click any symbol on graph to open its Graph for placing orders
Strength Calculation works: from beginning start of a Day , 1 Day ,2 Day---> 1 week
It works on any M5 Chat windows