Session Spreads
- Utilità
- Brian Lillard
- Versione: 4.0
- Aggiornato: 29 aprile 2020
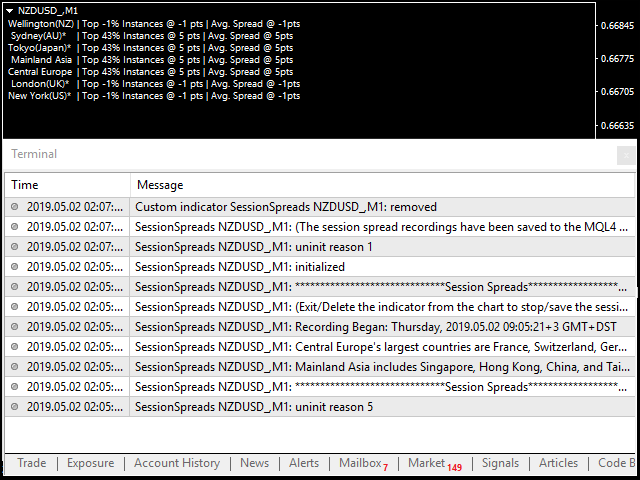
The 'Session Spreads' indicator was created to show spreads, their instances and averages, over the seven main sessions.
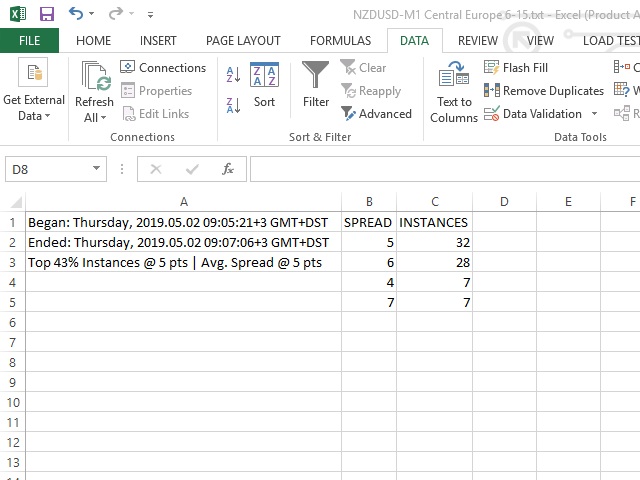
This shows the most average & useful spreads occurring the most on the seven main sessions on chart, and via/CSV files.
Key Features
- 7 Sessions automatically adjusted to the broker GMT & DST for logging spreads.
- Spreads logged per session with overlays equally processed on all applicable.
- Instances of spreads logged per spread amount that shows the most average.
- Average spreads are calculated per session and shows the actual averages.
Input Parameters
- Bars or Ticks = Ticks; - readings at the time of bar open or by ticks
- Log Data Files = true; - files optionally logged to MQL4\Files folder
- Wellington(NZ) begin hour = 20; - a minimum hour to log spreads
- Wellington(NZ) end hour = 5; - a maximum hour to log spreads
- Sydney(Australia) begin hour = 22; - a minimum hour to log spreads
- Sydney(Australia) end hour = 7; - a maximum hour to log spreads
- Tokyo(Japan) begin hour = 23; - a minimum hour to log spreads
- Tokyo(Japan) end hour = 8; - a maximum hour to log spreads
- Mainland Asia begin hour = 24; - a minimum hour to log spreads
- Mainland Asia end hour = 9; - a maximum hour to log spreads
- Central Europe begin hour = 6; - a minimum hour to log spreads
- Central Europe end hour = 15; - a maximum hour to log spreads
- London(UK) begin hour = 7; - a minimum hour to log spreads
- London(UK) end hour = 16; - a maximum hour to log spreads
- New York(USA) begin hour = 12; - a minimum hour to log spreads
- New York(USA) end hour = 21; - a maximum hour to log spreads
- Font's Color = White; - The color of labels shown on the chart
- Font's Name = MicroSoft YaHei; - The font shown on the chart
- Font's Size = 7; - The label's font size shown on the chart
- Label's Corner = 0; - The corner of labels shown on the chart
- Label's Left = 5; - The label left X position
- Label's Top = 13; - The label top Y position
- Label's X-Gap = 69; - The label's X positions between two sets of labels
- Label's Y-Gap = 12; - The label's Y positions between two rows of labels
Integration
- This indicator only produces labels on the chart and optionally text files.
Improvements
- Please be sure to leave any ideas, tips and suggestions in the "Reviews" section and they may be included.
- Improvements to the system could be at any time so we suggest that you possibly backup your copies.

