AQ XFifteen Pro
- Indicatori
- HIT HYPERTECH INNOVATIONS LTD
- Versione: 1.0
- Attivazioni: 5
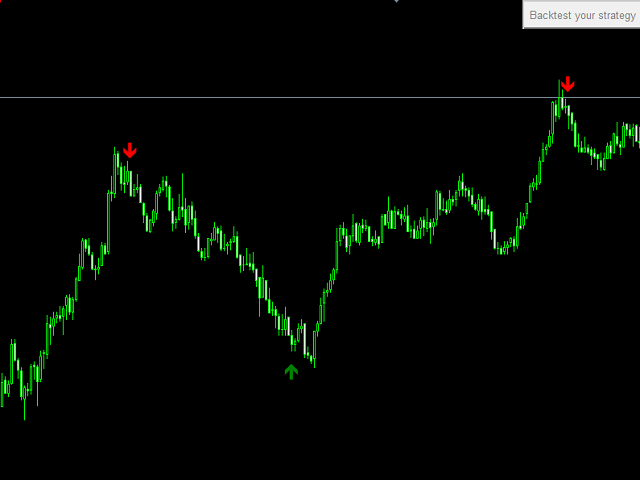
Χ15 indicator is a MetaTrader 4 tool that allows you to BUILD & BACKTEST ON REAL TIME your own strategies quickly, easily and efficiently. It contains 15 of the most popular technical analysis indicators that you can use, each one in a different way. Choose the indicators that you want to use, select how you will use them and you will see on the chart BUY (green) and SELL (red) arrows implementing your strategy. Choose Take Profit and Stop Loss and you will see the results of your strategy with FULL BACKTEST STATISTICS of all your candles on the selected chart.
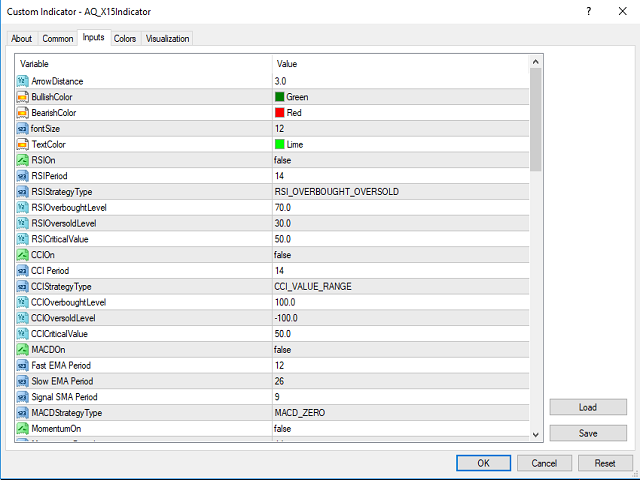
All indicators are fully parameterized by a user.
All indicators exist in user’s MetaTrader 4 platform, no special installation is needed.
In pro version, we have seriously improved the very successful X15 indicator with a unique Machine Learning filter that can boost your strategy. Build your strategy according to your rules and give it a serious boost by activating the aQuantTrendOn parameter. No matter what is the strategy that you build (Trend following, Reversal, Breakout etc) a-Quant trend algorithm will increase the profitability most of the times. It’s very easy to find it out by using X15 backtesting tool. Pro version also contains the very useful functionality of Alerts that notify you in every signal that occurs.
The indicators are:
- Two MAs, one fast and one slow with selection to use the fast, the slow or fast against slow
- RSI with selection to use overbought/oversold levels, RSI range and RSI above/below a critical value
- ADX with selection to use ADX critical level, ADX trend, +DI and –DI or all the above
- Stochastic with selection to use Stochastic value range or critical value level
- MACD with selection above/below zero, above/below MACD Signal or both
- Volume with selection above/below a level, volume above/below the Volume MA or both
- Bollinger Bands with selection to use range between the upper/lower bands or to use mid band
- Heiken Ashi with selection of the Heiken Ashi color
- CCI with selection of CCI overbought/oversold levels and CCI above/below a critical level
- Momentum with selection of Momentum direction
- OSMA with selection above/below zero, OSMA direction or both
- Parabolic SAR with selection above/below SAR dots
- Accelerator with selection above/below zero, Accelerator direction or both
- ATR with selection ATR direction
- Ichimoku with selection Chikou, Kumo, Kijun and Tenkan
Parameters
- ArrowDistance – distance in pips of the indicator arrows from each bar
- BullishColor – color for bullish/buy arrows
- BearishColor – color for bearish/sell arrows
- fontSize – font size for testing results on chart
- TextColor – color of text for testing results on chart
- RSIOn – true if you want to include RSI indicator into your strategy
- RSIPeriod – RSI period
- RSIStrategyType
- RSI_OVERBOUGHT_OVERSOLD means BUY if RSI is below the RSI Overbought level and SELL if RSI is above the RSI Oversold level
- RSI_VALUE_RANGE means BUY if RSI is between the RSI Overbought and RSI Oversold levels
- RSI_VALUE_UP_DOWN means BUY if RSI is above the critical level and SELL if RSI is below the critical level
- RSIOverboughtLevel – RSI Overbought level
- RSIOversoldLevel – RSI Oversold level
- RSICriticalValue – RSI critical level