Gamma Bands
- Indicatori
- Ziheng Zhuang
- Versione: 2.0
- Aggiornato: 12 marzo 2023
- Attivazioni: 5
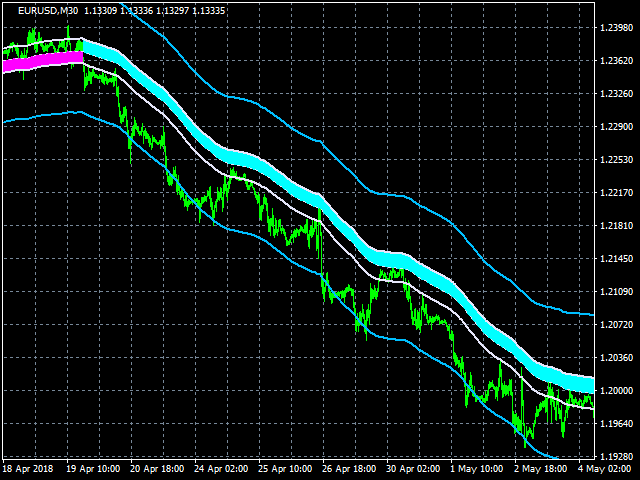
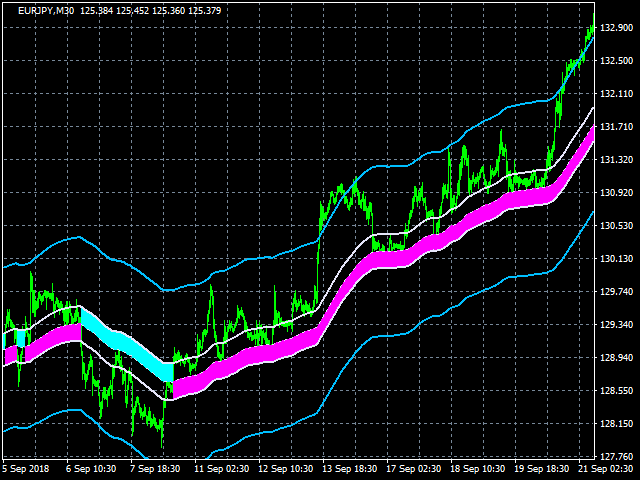
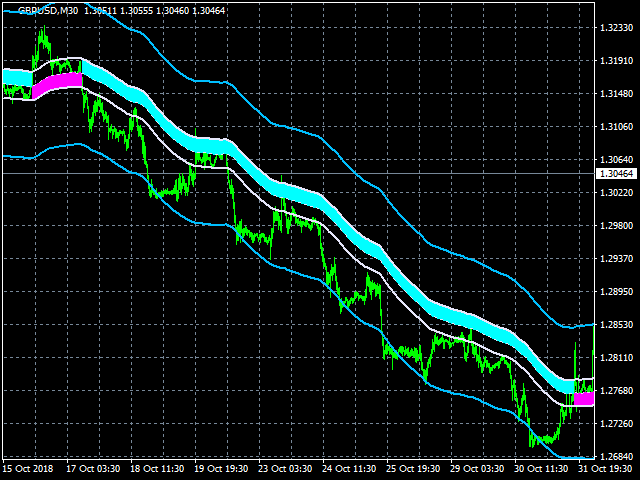
This indcator shows the trend with the color histogram. It is simple and easy to use.
Usage:
- If the histogram changes from the aqua to the fuchsia, which means the trend is up.
- If the histogram changes from the fuchsia to the aqua,which means the trend is down.
Inputs:
- MaPeriods: the periods of moving average.
- f1: the multiplier of inner bands
- f2: the multiplier of outer bands
- Popup Window Alert
- Email Alert
- Mobile Push Alert
Alerts
- When the trend changes from the long trend to the short trend or vice versa.
- When price crosses up the outter band,alert for closing buy orders.
- When price crosses down the outer band, alert for closing sell orders.
The version for MT5: Gamma Bands


L'utente non ha lasciato alcun commento sulla valutazione.