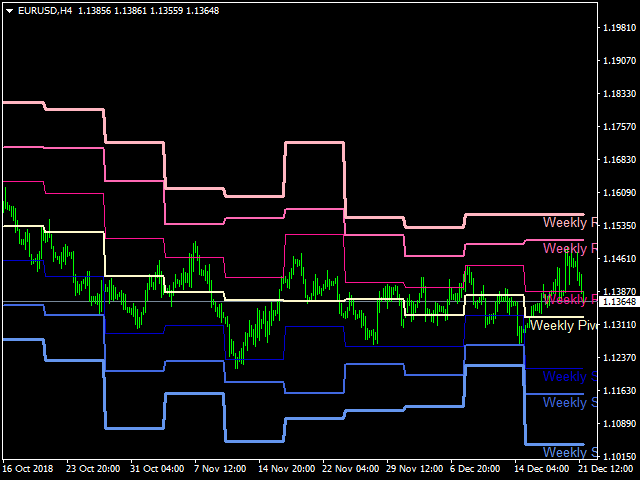
Week Pivot
- Indicatori
- Kourosh Hossein Davallou
- Versione: 1.0
- Attivazioni: 5
Weekly Pivot
There are a lot of advantages when trading with support and resistance lines, and they should be a staple in every trader's arsenal. Another effective method of deriving multiple horizontal based support and resistance lines is using a formula derived from yesterday's High, Low and Close bar. The formula maps out pivot point levels consisting of the pivot, and three levels of support and resistance, and these levels can be traded much the same way as trading with the regular support and resistance levels and trendlines, using a mix of breakout and bounce trading strategies.
The major advantage posited for this pivot point technique is that it is "objective" in the way that so many traders are using the same levels based on the same formula. There is no discretion involved. In contrast, the method of drawing support and resistance levels and trendlines can be more subjective and impressionist (every trader can notice and draw different lines), even though there have been attempts by DeMark and others to make them more objective.
A second related advantage of using them is that because so many people are looking at these levels, so they become self-fulfilling. The reason pivot points are so popular is that they are predictive as opposed to lagging. You use the information of the previous day to calculate reversal points (or breakout levels) for the present trading day. Because so many traders (including the large institutional traders) follow pivot points, the market reacts at these levels, giving you the opportunity to trade them. Just like we have seen with price action support and resistance levels, traders can choose to trade the bounce or the break of these levels.

