KT COG Advanced MT4
- Indicatori
- KEENBASE SOFTWARE SOLUTIONS
- Versione: 1.2
- Aggiornato: 27 settembre 2019
- Attivazioni: 5
KT COG is an advanced implementation of the center of gravity indicator presented by John F. Ehlers in the May 2002 edition of Technical Analysis of Stocks & Commodities magazine.
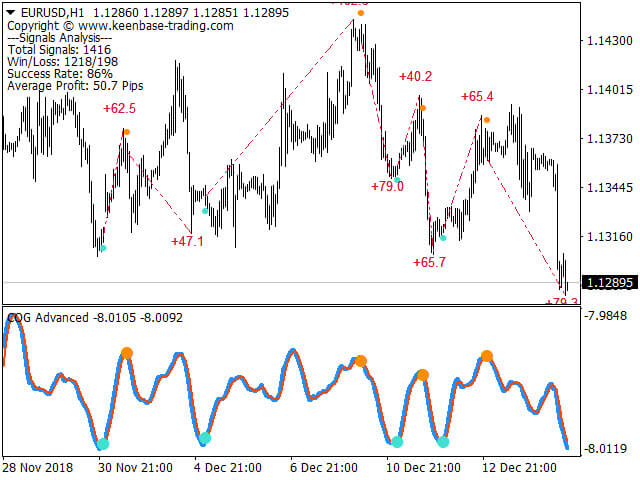
It's a leading indicator which can be used to identify the potential reversal points with the minimum lag. The COG oscillator catches the price swings quite effectively.
MT5 version of the same indicator is available here KT COG Advanced MT5
Calculation of COG
The COG indicator is consist of the two lines. The main line is based on the following formula
COG Line: -Sum(Time Series[i] * (i + 1)) / Sum(Time Series[i])
Signal Line: A moving average plotted on the COG line.
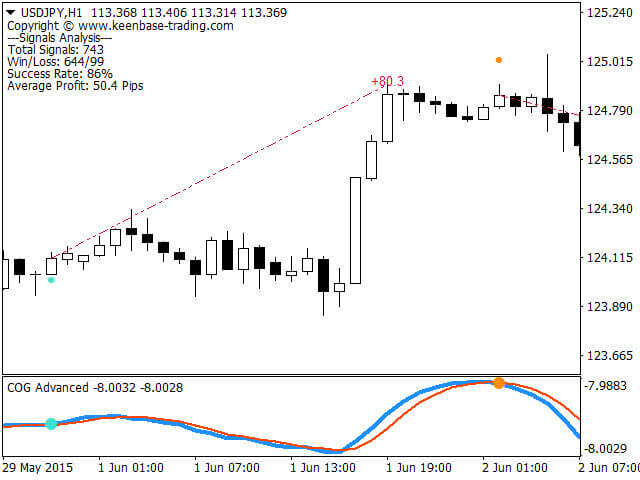
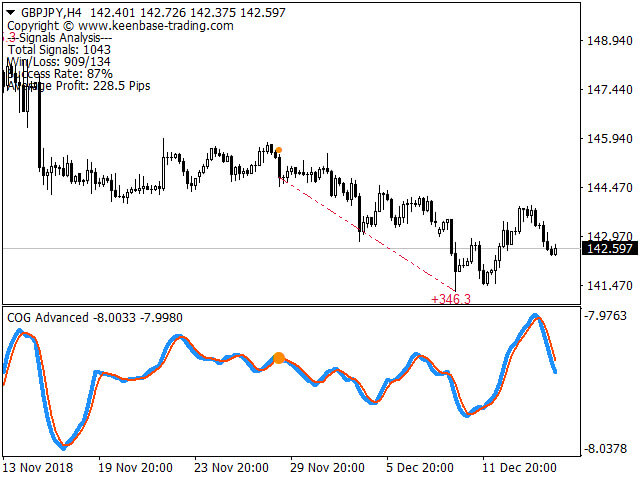
A buy signal is generated when the COG line crosses above the signal line and a sell signal is generated when the COG line crosses below the signal line.
Please note that the COG is a leading indicator. For profitable trading, each crossover cannot be used as the buy/sell signal. There is a need for adaptive filtration before this oscillator can be used for practical trading.
Advanced Filtration
Our adaptive filtration algorithm combines the original COG formula with the major trend direction and market acceleration/deceleration. The end result of such combination is that we get a smooth leading indicator in which the crossover can be used as the buy/sell signals.
Features
- Very good for the scalping on smaller time frames such as M1, M5 etc.
- Catches reversal points earlier with the minimum lag.
- Buy/Sell dots at each crossover for signal generation.
- Performance analysis metrics such as Win/Loss, Success rate, Avg. Profit etc.
- Can be combined and used as a filter with other indicators
Input Parameters
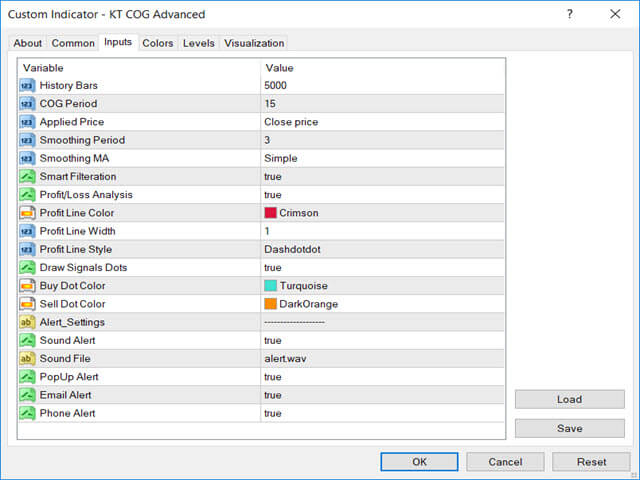
- COG Period: The period used for the calculation of main COG line.
- Smoothing Period: The period used for the calculation of signal line.
- Smart Filtration: Set the smart filtration true or false for the crossover signals.
- Performance Analysis: Set the performance analysis true or false.
- Draw Signal Dots: You can turn on/off the dots drawn at each crossover. Don't worry, even if you choose to not draw the signal dots, you'll still receive the alert for each crossover.








Junk. Purchased on 8-20-2019. Has not worked. For example, on the NZDJPY 4H chart, it has not produced ONE signal since 12-8-2020. (Chart photo on file) In fact, it was a sell signal and I was stopped out. To make matters worse, the indicator is showing profit from the bad signal and shows a profit of +40.3. If the indicator cost 15 bucks, I dont think I would be so upset, but 60 bucks for bad signals is terrible. Since that signal, it has not produced one signal using the default settings. Dont waste your money.