Netsrac Correlation Dashboard Free
- Indicatori
- Carsten Pflug
- Versione: 1.40
- Aggiornato: 13 febbraio 2021
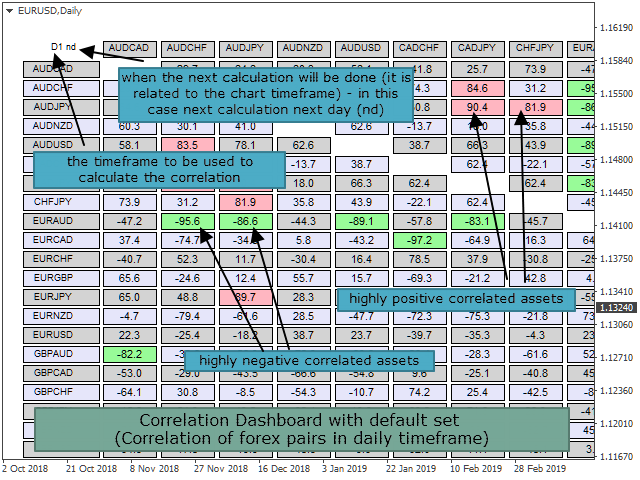
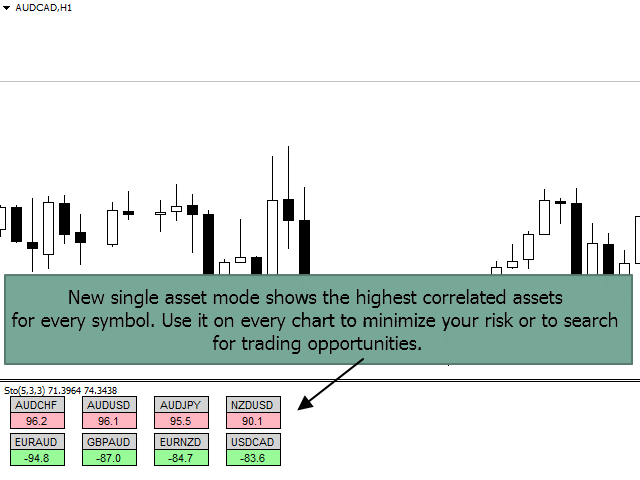
The dashboard should help to get a quick overview of the correlations of different assets to each other. For this, the value series are compared according to the Pearson method. The result is the value of the correlation (in percent). With the new single asset mode, you can immediately see which symbols have the highest positive or negative correlation. This prevents you from accidentally taking a risk on your trades with highly correlated symbols.
Usage
Display of the indicator
Options
(01) Mode
Switch between the new single asset mode and the classic dashboard view
(02) Use hole market watch symbols for single asset mode
If this is set to true, all symbols in your market watch are taken into account of the correlation calculation (only valid in single asset mode)
(03) How many correlated pairs to show
Set how many symbols are to be displayed in single asset mode
(08) underlyings
A list of underlyings separated by commas. Please note that all selected assets are also marked as active in MT4. Otherwise, the Dashboard will not return values for this UL.
(09) prefix
Enter the characters to be prefixed to the symbols configured in option 08
(10) suffix
Enter the characters to be suffixed to the symbols configured in option 08
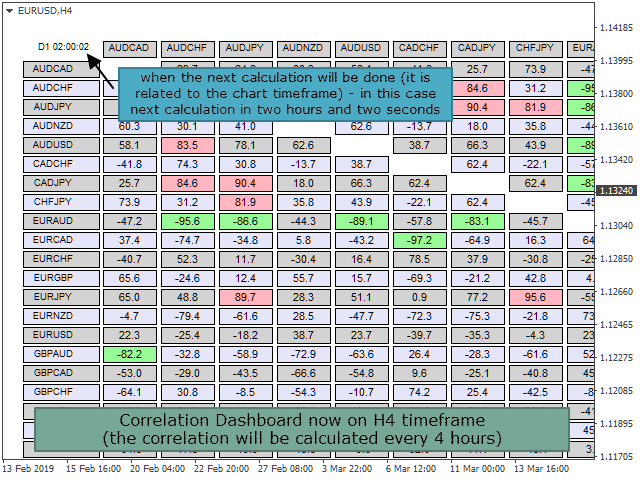
(11) use chart timeframe for calculation
If set to true here, the timeframe of the chart is used for the calculation. This setting is suitable for quick switching between the timeframes.
Configure the dashboard the way you want it to be and how it fits on the screen.
(29) vertical offset
Move the dashboard vertically to another position
(30) horizontal offset
Move the dashboard horizontally to another position
(31) Subwindow
Do you want to show the dashboard/single asset mode in main chart, first or second subwindow
(32) dashboard layout
Set the dashboard layout, if you have trouble to view on small screens
(This is the free version of the Netsrac Correlation Dashboard, which can be found here: https://www.mql5.com/en/market/product/33834. You can watch only three underlyings with the free version. Single Asset Mode is usable for AUDCAD only.)
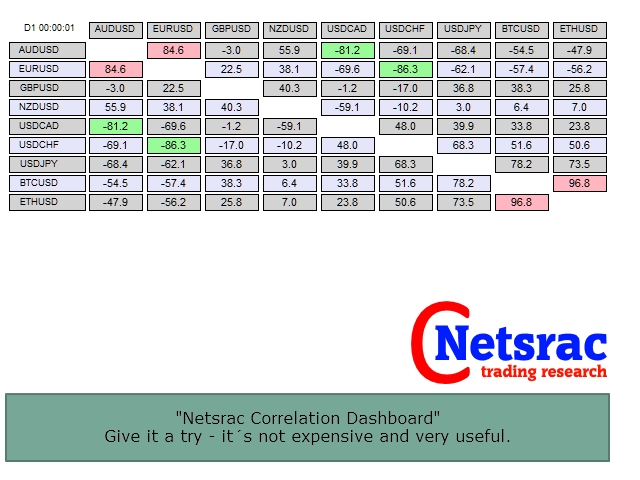

Thanks for sharing