• Panoramica
  • Recensioni
  • Commenti (4)
  • Novità

Weiss Wave with Zigzag and several data

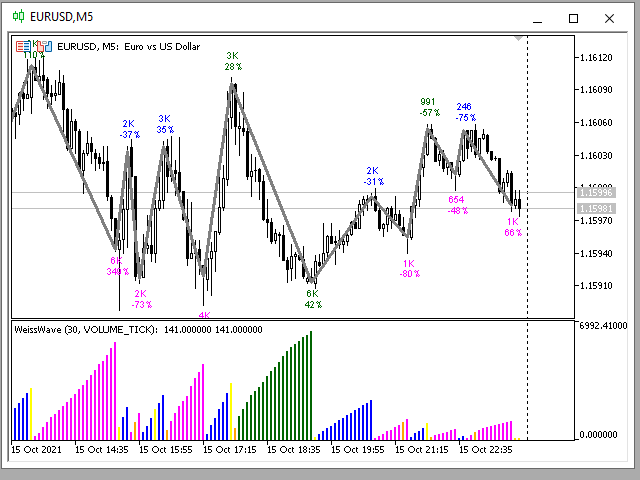
Weiss Wave with lots of functionality and lightweight. The same can be used both in markets that have access to volume (REAL=Contracts, Tick=Business) or points!


You will be able to:

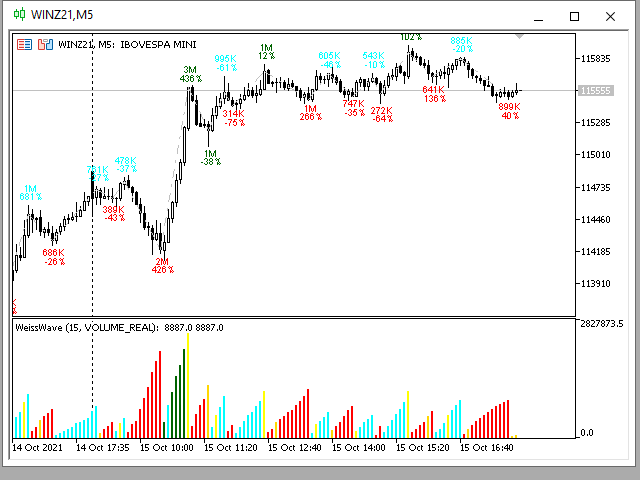
    - Analyze the volume of the market by swings made!

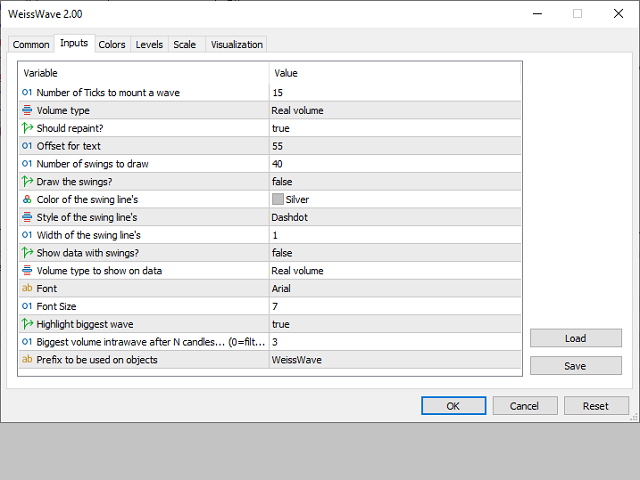
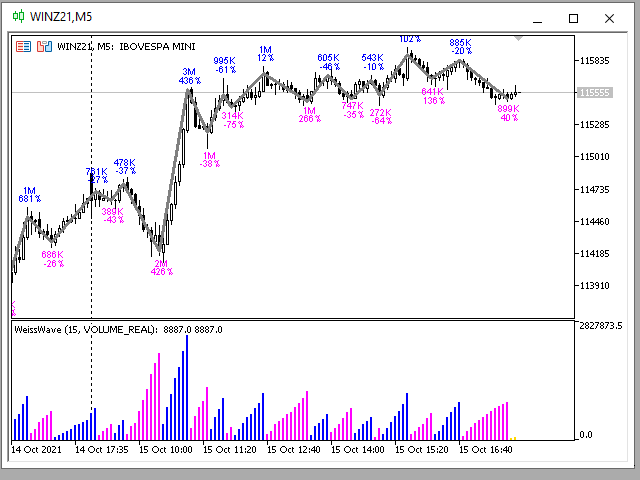
    - Define the source of the data presented in the graphic, its size and color! Or simply hide this information!

    - Define whether or not to show the swings in the graph and how many swings! In addition to setting the trend line color, thickness and trend line style!


The data shown in the chart when enabled are:

     - Volume or points (according to configuration);

     - Growth percentage in relation to the previous wave of the same type;

     - Wave pontuation achieved from one close to the next!
Prodotti consigliati
Supply and Demand Indicator + FREE Currency Strength Meter ADD-ON Looking for a powerful tool that can help you identify the most reactive zones in the forex market? Our supply and demand indicator for MetaTrader 4 and 5 is exactly what you need. With its advanced algorithms and real-time analysis, this indicator helps traders of all experience levels make informed trading decisions. The supply and demand indicator is a cutting-edge tool that helps traders identify areas where buyers and sellers
Weis Waves
Flavio Javier Jarabeck
2.83 (18)
The original author is David Weis, an expert in the Wyckoff Method. The Weis Wave is a modern adaptation of the 1930's Wyckoff Method, another expert in Tape Reading techniques and Chart Analysis. Weis Waves takes market volume and stacks it into waves according to price conditions giving the trader valuable insights about the market conditions. If you want to learn more about this subject you can find tons of videos in YouTube. Just look for "The Wickoff Method", "Weis Wave" and "Volume Spread
FREE
Description The indicator uses market profile theory to show the most relevant trading zones, on a daily basis. The zones to be shown are LVN (low volume nodes) and POC (point of control). An LVN zone is one which represents price areas with the least time or volume throughout the day. Typically, these areas indicate a supply or demand initiative, and in the future, they can turn into important breakout or retracement zones. A POC zone is one which represents price areas with the most time or vo
Crash 1000 Scalping Indicator for the Crash 1000 Deriv Synthetic Index. Introduction The Crash 1000 Scalping Indicator is a specialized tool designed for the Crash 1000 index on the Deriv Synthetic market. This indicator is particularly useful for scalping on the M1 timeframe, helping traders to identify precise entry and exit points for buy positions. It is designed to be non-repainting, providing clear signals with audible alerts and push notifications, and is compatible with mobile devices th
The new update makes this indicator a complete tool for studying, analyzing and operating probabilistic patterns. It includes: On-chart Multi-asset percentage monitor. Configurable martingales. Twenty-one pre-configured patterns, including Mhi patterns and C3. An advanced pattern editor to store up to 5 custom patterns. Backtest mode to test results with loss reports. Trend filter. Hit operational filter. Martingale Cycles option. Various types of strategies and alerts. Confluence between patter
Waves PRO
Flavio Javier Jarabeck
For those who appreciate Richard Wyckoff approach for reading the markets, we at Minions Labs designed a tool derived - yes, derived, we put our own vision and sauce into this indicator - which we called Waves PRO . This indicator provides a ZigZag controlled by the market volatility (ATR) to build its legs, AND on each ZigZag leg, we present the vital data statistics about it. Simple and objective. This indicator is also derived from the great book called " The Secret Science of Price and Volum
Wapv Price and volume
Eduardo Da Costa Custodio Santos
L'indicatore di prezzo e volume WAPV per MT5 fa parte del set di strumenti (Wyckoff Academy Wave Market) e (Wyckoff Academy Price and Volume). L'indicatore di prezzo e volume WAPV per MT5 è stato creato per semplificare la visualizzazione del movimento del volume sul grafico in modo intuitivo. Con esso puoi osservare i momenti di picco del volume e i momenti in cui il mercato non ha interesse professionale Identifica i momenti in cui il mercato si muove per inerzia e non per movimento di "denaro
Price Movement Classification Categorizes movements as significant/insignificant Tracks both direction and magnitude Considers volume in analysis Market Condition Identification Buying Pressure: More significant green candles Selling Pressure: More significant red candles Neutral Conditions: Balanced or low volatility Visual Representation Boxes show trading ranges Labels provide detailed statistics Color transitions mark significant changes Use Cases Market Analysis Identify hourly trading pat
Power of Three ICT Indicator in Smart Money Concept MT5 The Power of Three Indicator is an advanced trading tool available for MetaTrader 5 , designed to highlight three crucial market phases: Accumulation, Manipulation, and Distribution , which align with Smart Money trading principles. These phases represent distinct price behaviors, guiding traders in analyzing market stability, liquidity movements, and directional trends. The indicator marks accumulation zones with red boxes, while manipulat
WAPV Weis Wave Chart Forex
Eduardo Da Costa Custodio Santos
Il Weis Wave Chart Forex per MT5 è un indicatore di prezzo e volume. La lettura del prezzo e del volume è stata ampiamente diffusa tramite Richard Demille Wyckoff sulla base delle tre leggi da lui create: offerta e domanda, causa ed effetto e sforzo contro risultato. Già nel 1900 R.Wyckoff utilizzava la carta delle onde nelle sue analisi. Molti anni dopo, intorno al 1990, David Weis ha automatizzato il diagramma delle onde di R. Wyckoff e oggi vi portiamo l'evoluzione del diagramma delle onde di
- This is the exact conversion from TradingView: "Support/Resistance" By "BarsStallone". - This indicator lets you read the buffers for R/S values. - This is a non-repaint and light processing load indicator. - This is not a multi time frame indicator If you want the multi time frame version you should create a personal order and I deliver two files that you need them both to have the multi time frame indicator running on your system. - The MT4 version of the indicator is not light load from pr
Introducing the Order Block Indicator , the pinnacle of trading technology. Order blocks, the large cluster of buy or sell orders placed by institutional traders, significantly influence market direction. They form at critical price levels and can act as robust support and resistance zones. Our cutting-edge indicator allows you to harness the full potential of these influential market dynamics, providing a never-before-seen level of precision and customization. Here's why this tool stands apart:
The Penta-O is a 6-point retracement harmonacci pattern which usually precedes big market movements. Penta-O patterns can expand and repaint quite a bit. To make things easier this indicator implements a twist: it waits for a donchian breakout in the right direction before signaling the trade. The end result is an otherwise repainting indicator with a very reliable trading signal. The donchian breakout period is entered as an input. [ Installation Guide | Update Guide | Troubleshooting | FAQ | A
No Demand No Supply MT5
Trade The Volume Waves Single Member P.C.
No Demand No Supply   This indicator identifies   No Demand –No Supply candles to your chart and plots volume bars colored according to the signal. It can be applied to all timeframes or to a specific one only. It can also be used as regular volume indicator  with exceptional future of WEIGHTED VOLUME. Furthermore is has an alert notification, sound and email when a signals occurs. The indicator does not repaint but the alert will come on two candles back due to the definition of No Demand No Su
Best SAR MT5
Ashkan Hazegh Nikrou
4.33 (3)
Descrizione:  siamo felici di presentare il nostro nuovo indicatore gratuito basato su uno degli indicatori professionali e popolari nel mercato forex (PSAR) questo indicatore è una nuova modifica sull'indicatore SAR parabolico originale, nell'indicatore pro SAR puoi vedere l'incrocio tra i punti e il grafico dei prezzi, questo il crossover non è un segnale ma parla del potenziale di fine movimento, puoi iniziare a comprare con un nuovo punto blu e posizionare lo stop loss un atr prima del pri
FREE
B Xtrender
Yashar Seyyedin
To download MT4 version please click here . This is the exact conversion from TradingView: "B-Xtrender" By "QuantTherapy". - It is an oscillator based on RSI and multiple layers of moving averages. -   It is a two in one indicator to calculate overbought and oversold zones for different RSI settings. -  This indicator lets you read the buffers for all data on the window. - This is a non-repaint and light processing load indicator. - You can message in private chat for further changes you need.
PivotWave
Jeffrey Quiatchon
Introducing PivotWave – your ultimate trading companion that redefines precision and market analysis. Designed with traders in mind, PivotWave is more than just an indicator; it’s a powerful tool that captures the pulse of the market, identifying key turning points and trends with pinpoint accuracy. PivotWave leverages advanced algorithms to provide clear visual signals for optimal entry and exit points, making it easier for traders to navigate volatile market conditions. Whether you are a begin
To download MT4 version please click here . This is the exact conversion from TradingView: "WaveTrend [LazyBear]" By "zeusuk3". One of the coolest indicators out there to detect overbought and oversold zones. It can be used as a part of more complicated strategy and for confirming a potential trade setup. There are buffers to use in EAs also. The indicator is loaded light and non-repaint. - You can message in private chat for further changes you need. Thanks for downloading 
Follow The Line MT5
Oliver Gideon Amofa Appiah
4.52 (29)
This indicator obeys the popular maxim that: "THE TREND IS YOUR FRIEND" It paints a GREEN line for BUY and also paints a RED line for SELL. (you can change the colors). It gives alarms and alerts of all kinds. IT DOES NOT REPAINT and can be used for all currency pairs and timeframes. Yes, as easy and simple as that. Even a newbie can use it to make great and reliable trades. NB: For best results, get my other premium indicators for more powerful and reliable signals. Get them here: https://www.m
FREE
Volume Delta Candle
Muhammad Muzaffar Hussan
Volume Delta Candles: A Comprehensive Tool for In-Depth Trading Analysis Unlock a seamless way to interpret trading experience within each candle. With Volume Delta Candles, there's no need for additional volume indicators—everything you need is built in. This advanced tool utilizes lower timeframes or live market data to present the percentage of buying versus selling volume within each candle as an intuitive color-coded bar. Before diving in, ensure you’re familiar with Volume and Volume Delta
Volumes Direction MT5
William Oswaldo Mayorga Urduy
DIREZIONE VOLUMI MT5 Normalmente l'indicatore del volume ha un cambio di colore predefinito quando il volume corrente è più alto del precedente, è importante ma non molto utile. Per questo motivo è stato creato questo indicatore che oltre al volume normale, quando la candela è rialzista o ribassista, le dipinge di un colore diverso, di default è blu per rialzista e rosso per ribassista, ma questi colori possono essere personalizzati al Il gusto del commerciante. Non dimenticare di controll
Mini Chart Indicators
Flavio Javier Jarabeck
The Metatrader 5 has a hidden jewel called Chart Object, mostly unknown to the common users and hidden in a sub-menu within the platform. Called Mini Chart, this object is a miniature instance of a big/normal chart that could be added/attached to any normal chart, this way the Mini Chart will be bound to the main Chart in a very minimalist way saving a precious amount of real state on your screen. If you don't know the Mini Chart, give it a try - see the video and screenshots below. This is a gr
Value Chart Candlesticks
Flavio Javier Jarabeck
4.73 (11)
The idea of a Value Chart indicator was presented in the very good book I read back in 2020 , " Dynamic Trading Indicators: Winning with Value Charts and Price Action Profile ", from the authors Mark Helweg and David Stendahl. The idea is simple and the result is pure genius: Present candlestick Price analysis in a detrended way! HOW TO READ THIS INDICATOR Look for Overbought and Oversold levels. Of course, you will need to test the settings a lot to find the "correct" one for your approach. It
FREE
Range Directional Force Indicator – Designed for You to Optimize! The Range Directional Force Indicator is a cutting-edge tool designed to empower traders by visualizing market dynamics and directional strength. Built to offer insights into market trends and reversals, this indicator is an invaluable asset for traders seeking precision in their strategies. However, it is important to note that this indicator is not optimized , leaving room for you to tailor it to your unique trading preferenc
FlowVol AllinOne
Thalles Nascimento De Carvalho
FlowVol All-in-One: Analisi completa del flusso con DOM, VSA e Times and Sales SEI PRONTO A PORTARE LA TUA ANALISI DEL FLUSSO DI ORDINI SU MT5 A UN NUOVO LIVELLO? FlowVol All-in-One è lo strumento definitivo per i trader di flusso di ordini, combinando le tre principali tecniche di analisi del volume (DOM, VSA e Times and Sales) in un unico indicatore potente. È fondamentale avere accesso al libro ordini del broker per sfruttare tutto il potenziale di questo strumento di flusso. Ideale per
The Accumulation / Distribution is an indicator which was essentially designed to measure underlying supply and demand. It accomplishes this by trying to determine whether traders are actually accumulating (buying) or distributing (selling). This indicator should be more accurate than other default MT5 AD indicator for measuring buy/sell pressure by volume, identifying trend change through divergence and calculating Accumulation/Distribution (A/D) level. Application: - Buy/sell pressure: above
The Antique Trend Indicator is a revolutionary trend trading and filtering solution with all the important features of a trend tool built into one tool! The Antique Trend indicator is good for any trader, suitable for any trader both for Forex and binary options. There is no need to configure anything, everything has been perfected by time and experience, it works great during flats and trends. The Antique Trend indicator is a tool for technical analysis of financial markets, reflecting curren
Was: $249  Now: $149   Market Profile defines a number of day types that can help the trader to determine market behaviour. A key feature is the Value Area, representing the range of price action where 70% of trading took place. Understanding the Value Area can give traders valuable insight into market direction and establish the higher odds trade. It is an excellent addition to any system you may be using. Inspired by Jim Dalton’s book “Mind Over Markets”, this indicator is designed to suit the
Product overview  The HPL (High Probability Levels) indicator is a cutting-edge trading tool designed to identify high-probability levels in the market using imbalances. By leveraging the concept of imbalances, HPL provides traders with precise insights into potential market reversals and continuations, enhancing trading accuracy and decision-making. Key features  1. Imbalance detection : HPL automatically identifies and marks imbalances on the chart, highlighting areas where the market may seek
Flow Bookmap
Thalles Nascimento De Carvalho
Flow Bookmap: Visualizza il Flusso del Mercato e Proteggi le Tue Operazioni ️ VUOI DOMINARE IL MERCATO CON INFORMAZIONI PRECISE SU ACQUIRENTI E VENDITORI? Flow Bookmap è lo strumento definitivo per i trader che vogliono comprendere in profondità il comportamento del mercato. Trasforma i dati del flusso degli ordini in un'interfaccia intuitiva sul grafico MT5, evidenziando le zone di interesse critiche per prendere decisioni rapide e sicure. Come Funziona Flow Bookmap interpreta l'inter
Gli utenti di questo prodotto hanno anche acquistato
Golden Trend Indicator MT5
Noha Mohamed Fathy Younes Badr
4.88 (16)
Golden Trend indicator  is The best indicator for predicting trend movement this indicator never lags and never repaints and never back paints    and give  arrow buy and sell    before the candle appear  and it will help you and  will make your trading decisions clearer its work on all currencies and  gold and crypto and all time frame This unique  indicator uses very secret algorithms to catch the  trends, so you can trade using this indicator and see the trend clear on charts  manual guide and
FX Volume MT5
Daniel Stein
4.82 (17)
FX Volume: Scopri il Vero Sentimento di Mercato dalla Prospettiva di un Broker Panoramica Rapida Vuoi portare la tua strategia di trading a un livello superiore? FX Volume ti offre informazioni in tempo reale su come i trader retail e i broker sono posizionati—molto prima che compaiano report in ritardo come il COT. Che tu miri a guadagni costanti o desideri semplicemente un vantaggio più solido sui mercati, FX Volume ti aiuta a individuare grandi squilibri, confermare i breakout e perfezionar
CBT Quantum Maverick Sistema di Trading Binario ad Alta Efficienza CBT Quantum Maverick è un sistema di trading binario ad alte prestazioni progettato per trader che cercano precisione, semplicità e disciplina. Non è necessaria alcuna personalizzazione: il sistema è ottimizzato per fornire risultati efficaci fin dall'inizio. Con un po' di pratica, i segnali possono essere facilmente compresi. Caratteristiche principali: Precisione dei Segnali: Segnali di trading basati sulla candela attuale,
TPSproTREND PrO MT5
Roman Podpora
4.69 (16)
TPSpro TREND PRO   è un indicatore di tendenza che analizza automaticamente il mercato, fornisce informazioni sulla tendenza e sui rispettivi cambiamenti e fornisce segnali per entrare nelle operazioni senza ridisegnare. L'indicatore utilizza ciascuna candela e la analizza separatamente. Si riferisce a vari shock al rialzo o al ribasso. Punto di ingresso preciso per il trading di valute, criptovalute, metalli, azioni e indici! Versione MT5                   Descrizione completa dell'indicatore  
Top indicator for MT5   providing accurate signals to enter a trade without repainting! It can be applied to any financial assets:   forex, cryptocurrencies, metals, stocks, indices .  Watch  the video  (6:22) with an example of processing only one signal that paid off the indicator! MT4 version is here It will provide pretty accurate trading signals and tell you when it's best to open a trade and close it. Most traders improve their trading results during the first trading week with the help of
Questo cruscotto mostra gli ultimi   pattern armonici   disponibili per i simboli selezionati, in modo da risparmiare tempo ed essere più efficienti /   versione MT4 . Indicatore gratuito:   Basic Harmonic Pattern Colonne dell'indicatore Symbol :   vengono visualizzati i simboli selezionati Trend:   rialzista o ribassista Pattern:   tipo di pattern (gartley, butterfly, bat, crab, shark, cypher o ABCD) Entry:   prezzo di ingresso SL:   prezzo di stop loss TP1:   1 prezzo di take profit TP2:
Matrix Arrow Indicator MT5
Juvenille Emperor Limited
5 (13)
Matrix Arrow Indicator MT5   è un trend unico 10 in 1 che segue un indicatore multi-timeframe al   100% non ridipinto   che può essere utilizzato su tutti i simboli/strumenti:   forex ,   materie prime ,   criptovalute ,   indici ,   azioni .  Matrix Arrow Indicator MT5  determinerà la tendenza attuale nelle sue fasi iniziali, raccogliendo informazioni e dati da un massimo di 10 indicatori standard, che sono: Indice di movimento direzionale medio (ADX) Indice del canale delle materie prime (CCI
TPSpro RFI Levels MT5
Roman Podpora
4.53 (19)
ISTRUZIONI       RUS   -   INGLESE       Si   consiglia di utilizzare con un indicatore       -       TPSpro   TENDENZA PRO -   Versione MT4         Un elemento chiave nel trading sono le zone o i livelli da cui vengono prese le decisioni di acquisto o vendita di uno strumento di trading. Nonostante i tentativi dei principali attori di nascondere la loro presenza sul mercato, lasciano inevitabilmente delle tracce. Il nostro compito era imparare a identificare queste tracce e interpretarle corre
Gartley Hunter Multi
Siarhei Vashchylka
5 (9)
Gartley Hunter Multi - An indicator for searching for harmonic patterns simultaneously on dozens of trading instruments and on all possible timeframes. Manual (Be sure to read before purchasing) | Version for MT4 Advantages 1. Patterns: Gartley, Butterfly, Shark, Crab. Bat, Alternate Bat, Deep Crab, Cypher 2. Simultaneous search for patterns on dozens of trading instruments and on all possible timeframes 3. Search for patterns of all possible sizes. From the smallest to the largest 4. All fou
Bill Williams Advanced
Siarhei Vashchylka
5 (9)
Bill Williams Advanced is designed for automatic chart analysis using Bill Williams' "Profitunity" system. The indicator analyzes four timeframes at once. Manual (Be sure to read before purchasing) Advantages 1. Automatically analyzes the chart using the "Profitunity" system of Bill Williams. The found signals are placed in a table in the corner of the screen. 2. Equipped with a trend filter based on the Alligator indicator. Most of the system signals are recommended to be used only according t
RelicusRoad Pro MT5
Relicus LLC
4.78 (18)
Ora $ 147 (aumentando a $ 499 dopo alcuni aggiornamenti) - account illimitati (PC o MAC) Manuale utente di RelicusRoad + Video di formazione + Accesso al gruppo Discord privato + Stato VIP UN NUOVO MODO DI GUARDARE IL MERCATO RelicusRoad è l'indicatore di trading più potente al mondo per forex, futures, criptovalute, azioni e indici, fornendo ai trader tutte le informazioni e gli strumenti di cui hanno bisogno per rimanere redditizi. Forniamo analisi tecniche e piani di trading per aiutare og
FxaccurateLS
Shiv Raj Kumawat
WHY IS OUR FXACCCURATE LS MT5 THE PROFITABLE ? PROTECT YOUR CAPITAL WITH RISK MANAGEMENT Gives entry, stop and target levels from time to time. It finds Trading opportunities by analyzing what the price is doing during established trends. POWERFUL INDICATOR FOR A RELIABLE STRATEGIES We have made these indicators with a lot of years of hard work. It is made at a very advanced level. Established trends provide dozens of trading opportunities, but most trend indicators completely ignore them! The
Quantum TrendPulse
Bogdan Ion Puscasu
5 (13)
Ecco   Quantum TrendPulse   , lo strumento di trading definitivo che combina la potenza di   SuperTrend   ,   RSI   e   Stocastico   in un unico indicatore completo per massimizzare il tuo potenziale di trading. Progettato per i trader che cercano precisione ed efficienza, questo indicatore ti aiuta a identificare con sicurezza le tendenze di mercato, i cambiamenti di momentum e i punti di entrata e uscita ottimali. Caratteristiche principali: Integrazione SuperTrend:   segui facilmente l'andame
Atomic Analyst MT5
Issam Kassas
4.32 (19)
Innanzitutto, vale la pena sottolineare che questo indicatore di trading non è repaint, non è ridisegno e non presenta ritardi, il che lo rende ideale sia per il trading manuale che per quello automatico. Manuale utente: impostazioni, input e strategia. L'Analista Atomico è un indicatore di azione del prezzo PA che utilizza la forza e il momentum del prezzo per trovare un miglior vantaggio sul mercato. Dotato di filtri avanzati che aiutano a rimuovere rumori e segnali falsi, e aumentare il pote
L'indicatore Quadrato di Gann è uno strumento potente di analisi di mercato basato sull'articolo "Formula Matematica per le Previsioni di Mercato" scritto da W.D. Gann. Questo strumento utilizza concetti matematici e teorie di Gann per effettuare un'analisi precisa del mercato. Utilizza i quadrati di 144, 90, 52 e anche il quadrato di 9. Inoltre, integra il metodo del  per il quadrato di 9 e la sua relazione con canali e modelli stellari di quel quadrato. Manuale Utente e Applicazione: Prima di
BookMap HeatMap
Roberto Spadim
1 (2)
This Indicator creates a heatmap based on depth of market of the current symbol or another symbol. Other symbol is useful when you trade futures market and a contract has 'mini' and 'full' split. For example, in Brazil (B3 - BMF&Bovespa), WDO and DOL are future Forex contract of BRL/USD (where 1 DOL = 5 WDO) and big banks work mostly with DOL (where liquidity is important). Please use with M1 timeframe , objects are too small to be displayed at higher timeframes (MT5 limit). The number of level
Berma Bands
Muhammad Elbermawi
5 (3)
L'indicatore Berma Bands (BBs) è uno strumento prezioso per i trader che cercano di identificare e capitalizzare i trend di mercato. Analizzando la relazione tra il prezzo e le BBs, i trader possono discernere se un mercato è in una fase di trend o di range. Visita il [ Berma Home Blog ] per saperne di più. Le Berma Bands sono composte da tre linee distinte: la Upper Berma Band, la Middle Berma Band e la Lower Berma Band. Queste linee sono tracciate attorno al prezzo, creando una rappresentazion
Presentazione       Quantum Breakout PRO   , l'innovativo indicatore MQL5 che sta trasformando il modo in cui scambi le zone di breakout! Sviluppato da un team di trader esperti con un'esperienza di trading di oltre 13 anni,       Quantum Breakout PRO       è progettato per spingere il tuo viaggio di trading a nuovi livelli con la sua strategia innovativa e dinamica della zona di breakout. Quantum Breakout Indicator ti fornirà frecce di segnalazione sulle zone di breakout con 5 zone target di
Easy Breakout MT5
Mohamed Hassan
5 (3)
After your purchase, feel free to contact me for more details on how to receive a bonus indicator called VFI, which pairs perfectly with Easy Breakout for enhanced confluence!     Easy Breakout MT5   is a powerful price action trading system built on one of the most popular and widely trusted strategies among traders: the   Breakout strategy ! This indicator delivers crystal-clear Buy and Sell signals based on breakouts from key support and resistance zones. Unlike typical breakout indicators
Quantum Heiken Ashi PRO MT5
Bogdan Ion Puscasu
4.44 (9)
Ti presentiamo   Quantum Heiken Ashi PRO Progettate per fornire informazioni chiare sulle tendenze del mercato, le candele Heiken Ashi sono rinomate per la loro capacità di filtrare il rumore ed eliminare i falsi segnali. Dì addio alle confuse fluttuazioni dei prezzi e dai il benvenuto a una rappresentazione grafica più fluida e affidabile. Ciò che rende il Quantum Heiken Ashi PRO davvero unico è la sua formula innovativa, che trasforma i dati tradizionali delle candele in barre colorate di faci
Advanced Supply Demand MT5
Bernhard Schweigert
4.5 (14)
La migliore soluzione per qualsiasi principiante o trader esperto! Questo indicatore è uno strumento di trading unico, di alta qualità e conveniente perché abbiamo incorporato una serie di funzionalità proprietarie e una nuova formula. Con questo aggiornamento, sarai in grado di mostrare fusi orari doppi. Non solo potrai mostrare una TF più alta, ma anche entrambe, la TF del grafico, PIÙ la TF più alta: SHOWING NESTED ZONES. Tutti i trader di domanda di offerta lo adoreranno. :) Informazioni imp
Extreme  Breakout Signal   is a trading strategy based on price breaking through key support or resistance levels. It indicates potential trend shifts, allowing traders to capture new upward or downward movements. Parameter extreme radius:   extreme radius( Different parameters can be set for different periods ) Key Principles Support & Resistance : Prices often reverse near these levels; breaking them may signal a new trend. Confirmation : Use volume or other indicators to verify the breakout's
Golden Spikes Detector
Batsirayi L Marango
3.25 (4)
Golden Spikes Detector This indicator is based on an advanced strategy primarily for trading spikes on Boom and Crash Indices. Complex algorithms were implemented to detect high probability entries only. It alerts on potential Buy and Sell entries. To trade spikes on the Deriv or Binary broker, only take Buy Boom and Sell Cash alerts. It was optimised to be loaded on 5-minute timeframe although multiple timeframe analysis is done in the background. Features ·             Desktop pop up and sound
KT Renko Patterns MT5
KEENBASE SOFTWARE SOLUTIONS
KT Renko Patterns scans the Renko chart brick by brick to find some famous chart patterns that are frequently used by traders across the various financial markets. Compared to the time-based charts, patterns based trading is easier and more evident on Renko charts due to their uncluttered appearance. KT Renko Patterns features multiple Renko patterns, and many of these patterns are extensively explained in the book titled Profitable Trading with Renko Charts by Prashant Shah. A 100% automated
Innanzitutto è importante sottolineare che questo sistema di trading è un indicatore Non-Repainting, Non-Redrawing e Non-Lagging, il che lo rende ideale sia per il trading manuale che per quello automatico. Corso online, manuale e download di preset. Il "Sistema di Trading Smart Trend MT5" è una soluzione completa pensata sia per i trader principianti che per quelli esperti. Combina oltre 10 indicatori premium e offre più di 7 robuste strategie di trading, rendendolo una scelta versatile per div
Royal Scalping Indicator M5
Vahidreza Heidar Gholami
5 (6)
Royal Scalping Indicator is an advanced price adaptive indicator designed to generate high-quality trading signals. Built-in multi-timeframe and multi-currency capabilities make it even more powerful to have configurations based on different symbols and timeframes. This indicator is perfect for scalp trades as well as swing trades. Royal Scalping is not just an indicator, but a trading strategy itself. Features Price Adaptive Trend Detector Algorithm Multi-Timeframe and Multi-Currency Trend Low
Monster Harmonics Indicator is a harmonic pattern indicator. It recognizes Gartley, Bat, Crab, Butterfly, Cypher, White Swan, Black Swan, Shark and AB=CD patterns. Projected patterns that are not yet completed are recognized, too. Monster even shows the PRZ (Potential Reversal Zone). Users can add their own user defined patterns to Monster. Besides the current pattern, Monster also shows all patterns in the symbols history. Monster will provide alerts for developing patterns. Introduced by H.M.
SEE THE TREND ON EVERY TIME FRAME. INTELLIGENT INDICATOR READS PRICE ACTION TO SPOT TRUE MARKET CYCLES AND TREND. This advanced multi-currency and multi-time frame indicator,   reads trend in real-time   so you always know the trends of the markets   you want to trade.  ​Trend-Viewer Pro has been specifically designed to read the trend of   every time frame   and   every market , simultaneously, making it much easier for you to find markets with   time frame correlation , so you can focus on th
KT Momentum Arrows MT5
KEENBASE SOFTWARE SOLUTIONS
5 (2)
KT Momentum Arrows Indicator is based on a momentary breakout which is calculated using the bands deviation and emerging volatility in a certain direction. A buy signal is generated when the price closes above the upper band and a sell signal is generated when the price closes below the lower band. A magnitude coefficient is used as the input which affects the band deviation and volatility at the same time. The coefficient value should be carefully selected and analyzed based on the instrument a
Gartley Hunter MT5
Siarhei Vashchylka
5 (13)
Gartley Hunter - An indicator for searching for harmonic patterns (Gartley patterns) and their projections. The indicator is equipped with a system of alerts and push notifications. Manual (Be sure to read before purchasing) | Version for MT4 Advantages 1. 12 harmonic patterns: 7 classical and 5 exotic. New patterns will be added as the indicator develops. 2. Constant automatic search for harmonic patterns. The indicator is capable of finding from the smallest to the largest patterns. 3. Automa
Altri dall’autore
Prior Cote
Ricardo Rodrigues Lucca
In this indicator you choice a data to be used from yesterday (high, low, open, close, etc) to automatically draw an line to be the zero. And, from that a percentage deviation ("Percentage to be used") is calculated and used to draw others line to both side until a limit be reached. Both sides can have diferrent colours as show in screenshots. Also, more than one indicator can be used at same time.
FREE
Narrow Range Timeframe
Ricardo Rodrigues Lucca
4.5 (2)
This indicator utilizes the Narrow Range 7 concept . This concept says that if the seventh candle is the one with the smallest range, that is, the smallest difference between maximum and minimum of all 7 candles. The indicator marks this candle with two markers and waits for a breakout to happens in the next 6 candles. It's called "timeframe" because if in the next 6 candles the breakout not happens, it will remove all marks on candle. If it exceeds 7 times the timeframe, it also will remove the
FREE
Moving Ratio
Ricardo Rodrigues Lucca
"Moving Ratio Candle" is used to check the distance of a candle to a theoretical pressure point. Furthermore, we have two points of interest, the first for the mean and the second for the median. This indicator uses the shape of bars and the line that crosses the bar from left to right is based on the calculation of the closing price for both sides. The rest follows a more standard calculation. The same could be done as a line, but I want to know the behavior of this indicator in relation to the
FREE
Stormer RSI 2
Ricardo Rodrigues Lucca
This strategy was learned from Stormer to be used on B3. Basically, 15 minutes before closing the market, it will check RSI and decided if it will open an position. This strategy do not define a stop loss. If the take profit reach the entry price it will close at market the position. The same happens if the maximal number of days is reached. It is created to brazilian people, so all configuration are in portuguese. Sorry Activations allowed have been set to 50.
Filtro:
Nessuna recensione
Rispondi alla recensione
Versione 2.0 2021.10.16
* Removed font coloring, the color used is the same as the histogram;
* Removed points from the summary data, to make the chart cleaner;
* Highlight the biggest wave of the day (its color is 4);
* Highlight the candle with the greatest volume in a wave since we have N candles (the color can be 5 or 6);