ZigZag based on ATR and Fibo retracement
- Indicatori
- Petr Nosek
- Versione: 1.0
Description
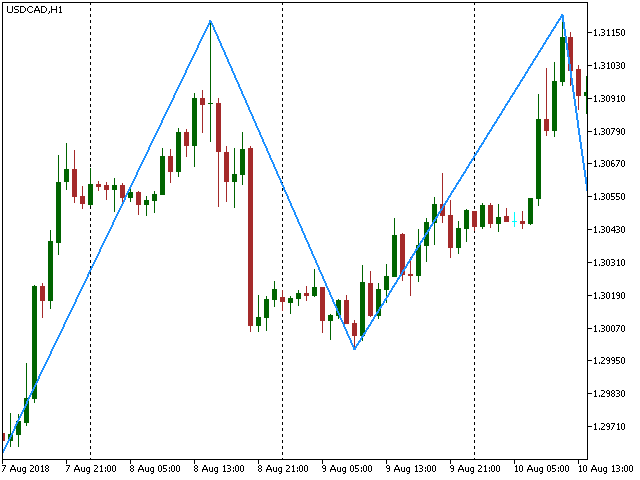
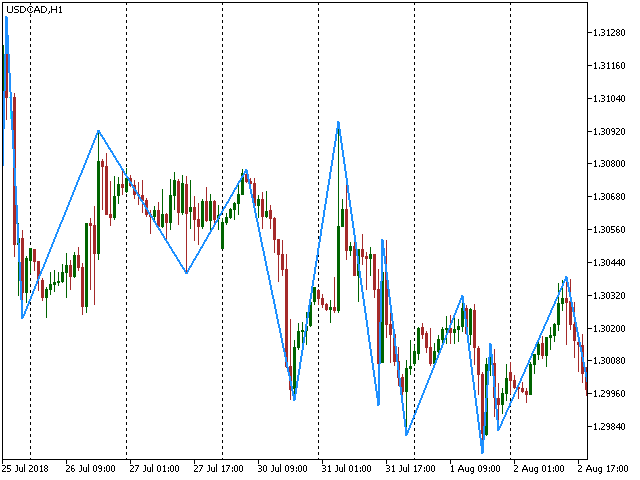
The base of this indicator is an ZigZag algorithm based on ATR and Fibo retracement. This indicator is not redrawing in sense that the ZigZag's last shoulder is formed right after the appropriate conditions occur on the market. The shoulder doesn't change its direction afterwards (can only continue).
Note: An indicator with advanced possibilities is also available.
Indicator input parameters
The input parameters allow to change the sensitivity of the ZigZag.
- ATR period
- ATR multiplier that doesn't allow a direction change
- ATR multiplier that forces a direction change
- Minimum percent retracement that forces a direction change