AR Dashboard
- Indicatori
- Francesco Rubeo
- Versione: 1.2
- Aggiornato: 13 settembre 2018
- Attivazioni: 20
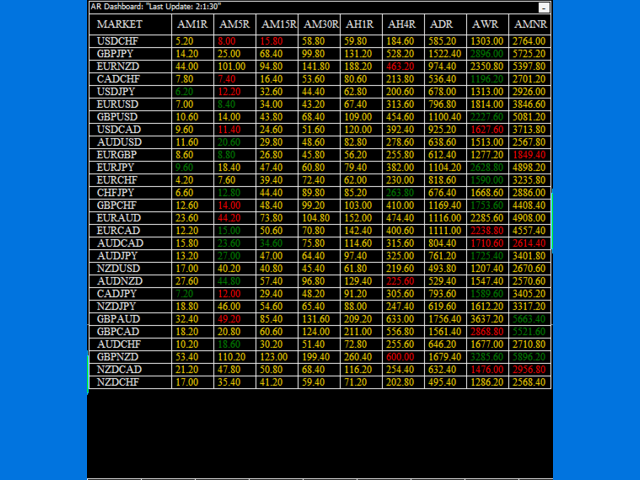
Easily and rapidly access to the average range of all the markets with "A.R. Dashboard"!!
This professional multi-timeframe indicator will show you the average range of all desired markets (till 50) with one click!!
Choose the number of bars to calculate the average range and this indicator will show you, automatically, this average range in points of the chosen markets for each timeframe.
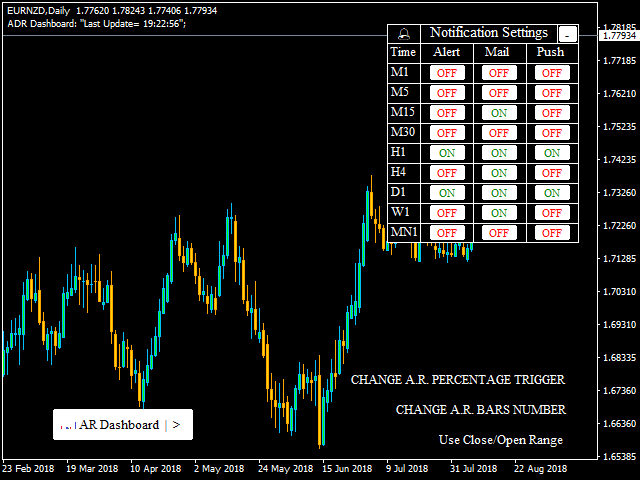
You'll have at your disposal two panels:
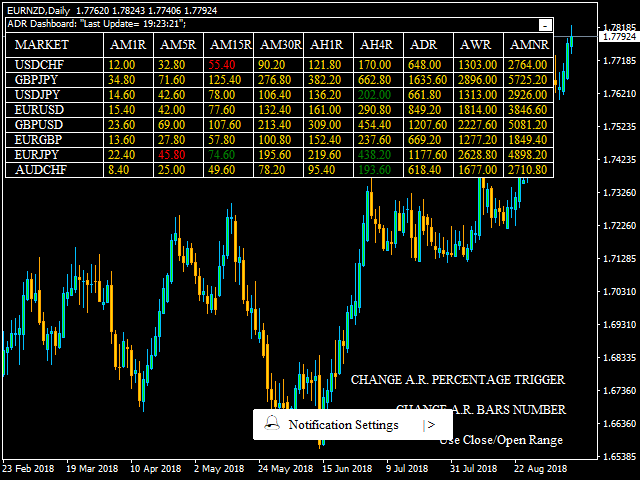
- AR Dashboard: Main panel.
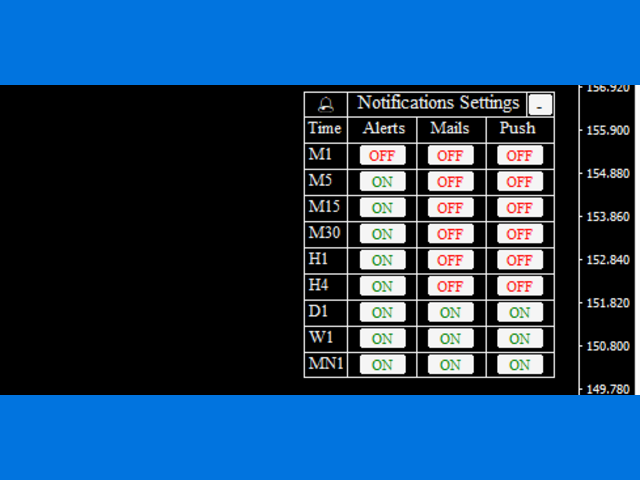
- Notifications Settings: Here you can set if you want to receive Alerts, Mails or Push Notifications with a simple click. You'll receive notifications when a market "break" up/down his average range on a particular chosen timeframe.
Below on the right you can find three buttons:
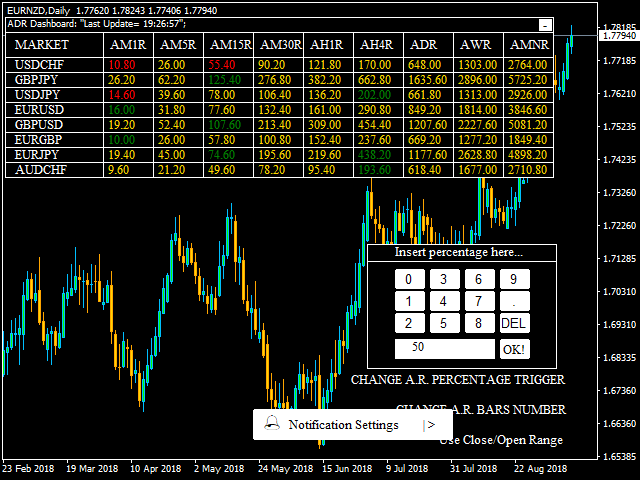
- CHANGE A.R. PERCENTAGE TRIGGER: On default you'll receive notifications when the 100% of the average range is broken. Here you can set your favourite percentage that has to be exceeded. I.E.: if the market has 100 pips (1000 points) of average daily range, using 50% you'll receive notifications as the market reaches 50 pips (500 points).
CHANGE A.R. BARS NUMBER: The initial value will be chosen by the user on the input parameters. You'll be able to change the number of the bars on which calculate the average range even after the indicator is loaded.
Use Close/Open Range / Use High/Low Range: This button changes in relation to the currently used range. On default high minus low range is used. An average range calculated using High minus Low is clearly different compared to an average range calculated using Close minus Open in absolute value. In the first case your chosen notifications will appear calculating High minus Low of the current bar, in the second case your chosen notifications will appear calculating Close minus Open (abs.value) of the current bar.
Input Parameters:
Average Range Bars: Number of bars to calculate the average range.
Buy Color: Set your favourite color for buy signals.
Sell Color: Set your favourite color for sell signals.
Background Color: Set your favourite background color for panels.
Front Color: Set your favourite front color for panels.
Neutral Color: Set your favourite color when the market is inside the average range.
Font Size: Set your favourite font size.
Font Type: Set your favourite font type.
Markets: Here you can insert the markets to analyze. On default we have the 28 main crosses composing forex. If your broker is using different names like EURUSDp instead of EURUSD you'll be able to change the market name (P.N.: The names have to be written exactly as written on your Metatrader MarketWatch).
Clicking on a particular average range, the indicator will open automatically the graphic of that market on that timeframe.
P.N.:On the Strategy Tester you'll be able to see only the market on which you have loaded the indicator, we suggest to launch the indicator on m1 timeframe, to have the correct average range on each timeframe.

