Pivots Channels Breakouts
- Indicatori
- Richard Jehl
- Versione: 1.0
- Attivazioni: 10
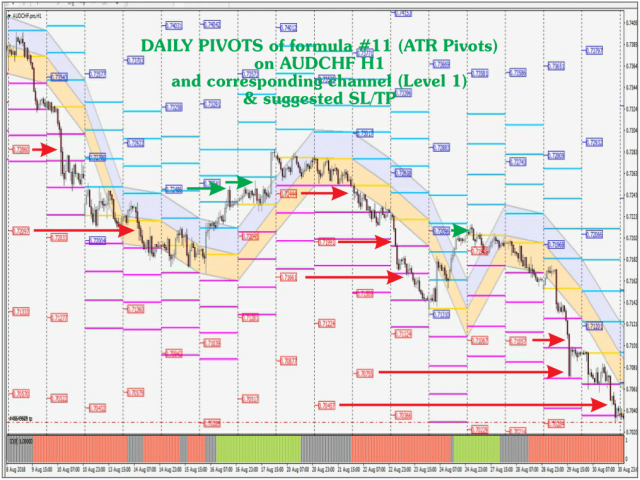
Pivots Channels Breakouts presents 16 different formulas for Pivots Levels. It draws each one of them and also draws specific channels, trend histograms, and SL/TP levels derived from them.
It includes commonly used formulas as Classic, Woodie, ATR, Fibonacci, Camarilla and Demark Pivots, and also presents never seen before formulas based on the Padovan mathematical sequence.
Price often reacts at Pivots levels, and at Resistances (R) and Supports (S) of these formulas. That is why a lot of traders look at them and take them into consideration in their trading.
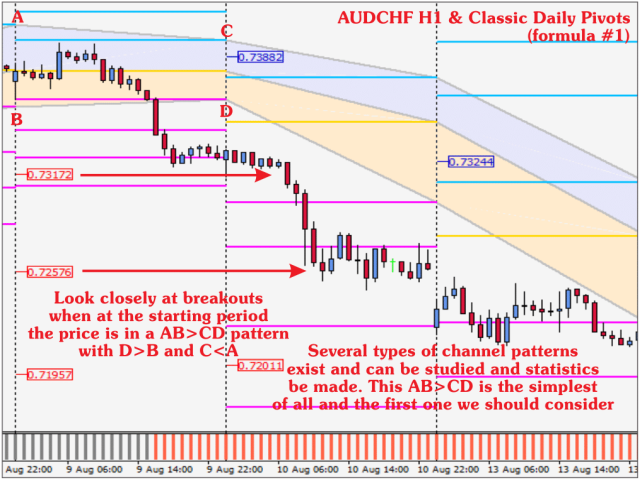
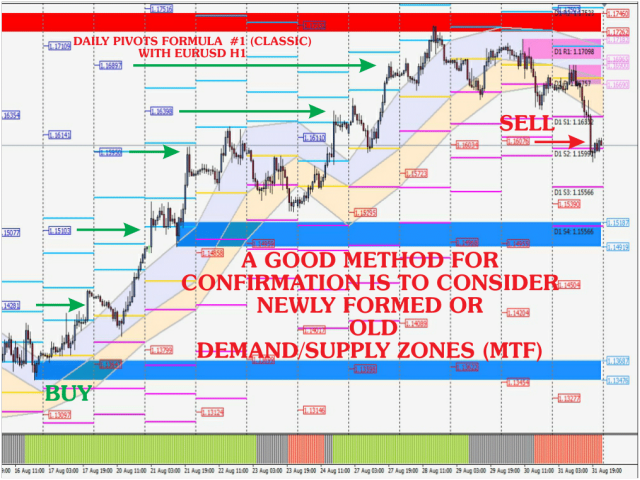
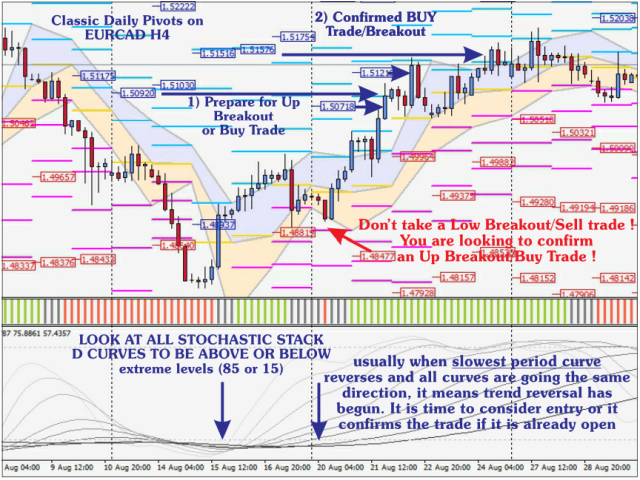
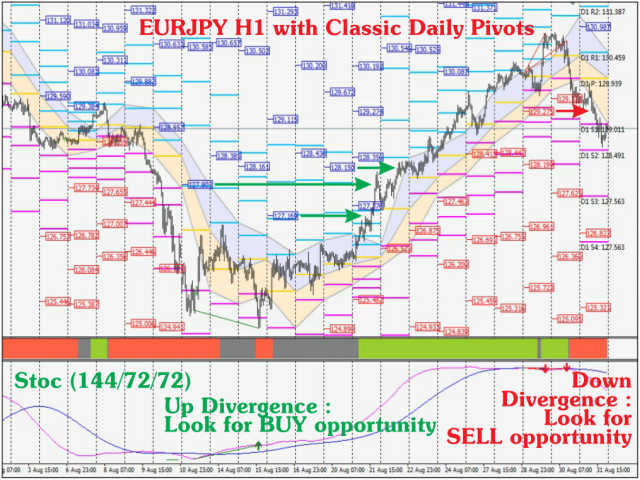
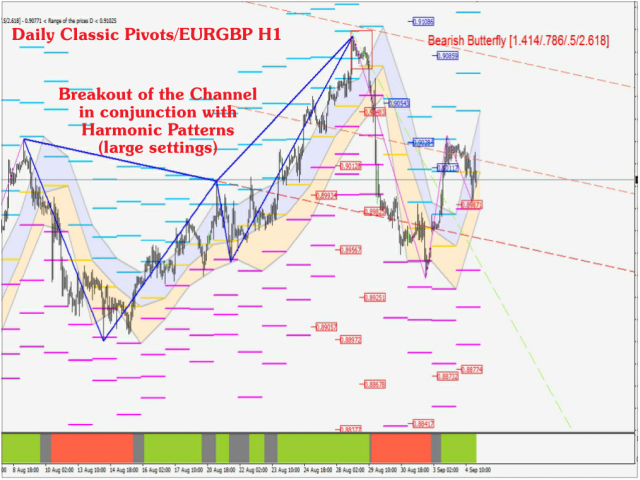
The indicator plots channels derived from the Resistance and Support levels and allows to consider the breakout of these channels for a potential trade in direction of the breakout. Trading using the informations given by the indicator for breakout trades may not be the only successful approach, but the indicator was first intended to be used this way. The purpose is surely not to enter on every breakout, but if the entries are properly filtered considering currency strength, overbought/oversold levels (using Stochastic with coherent periods for example, or Stochastic D curves Stack) or Supply/Demand zones, there will be noticeably more winning trades than losing trades, which makes the indicator very valuable.
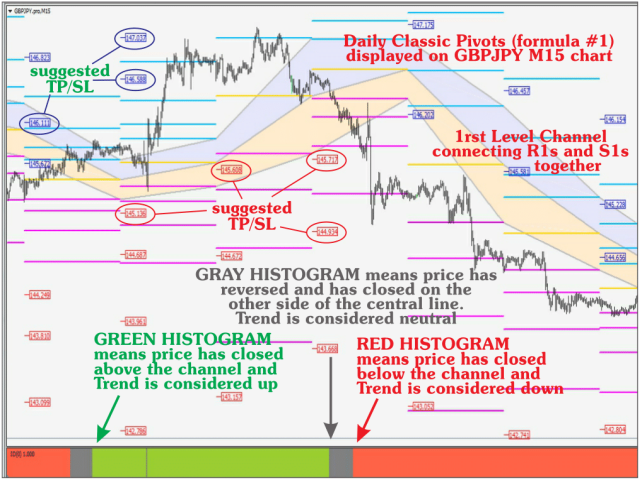
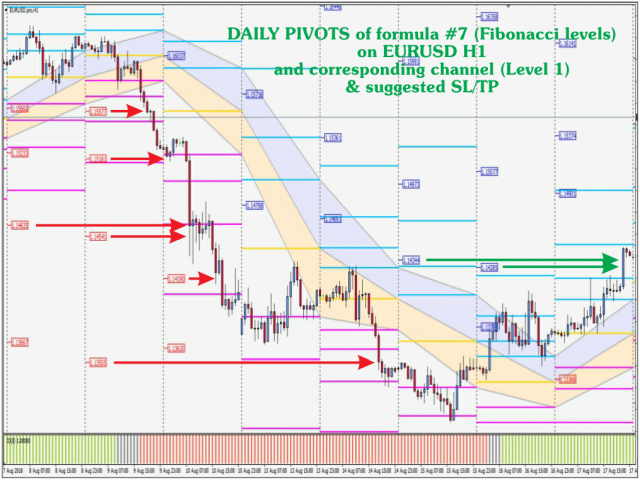
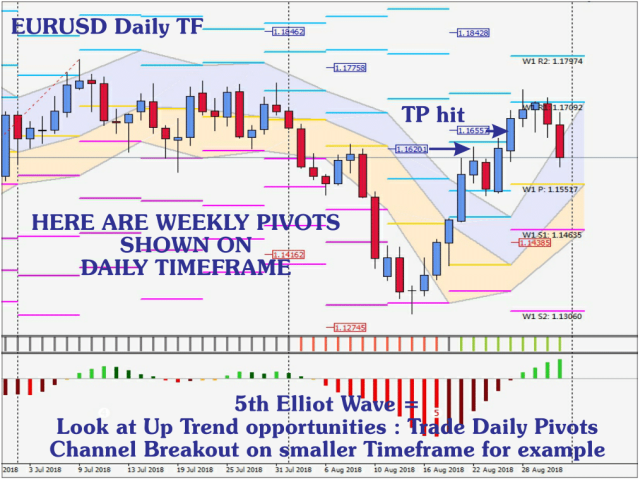
The indicator suggests entry points by looking at imminent, currently happening, or recently past breakouts of the channels, but trade management is also crucial : a trader has to precisely place Stop Loss (SL) and Take Profit (TP). Resistances, Supports, and Pivots themselves can be used for SL/TP, but in addition, the indicator proposes highly significant price levels which can be used for deciding SL and TP. Those highly significant price levels are derived from the Pivots, Resistances and Supports values.
Screenshots present a few methods for filtering trades, but these are not exhaustive and a trader shall use one or several at his/her discretion.
It is advised to first study and get used to the Classic formula and its channel, before possibly studying and using other formulas. Some of the formulas have 9 Resistance Levels and 9 Support Levels but as each one of these levels can be enabled or disabled independantly, it is possible to draw only the levels we find necessary or significant. For the Padovan formulas for example, we'll find that enabling only odd-numbered levels (levels 1 - 3 - 5 - 7 - 9) or only even-numbered levels (levels 2 - 4 - 6 - 8) is wishable or sufficient. This comes from the nature of the Padovan sequence (1 - 1 - 1 - 2 - 2 - 3 - 4 - 5 - 7 - 9 - 12 - 16 - 21 etc) in which a number is the sum of the antepenultimate number and its predecessor. This sequence makes the structures derived from it even closer to nature than structures derived from the golden number and the Fibonacci sequence.
Parameters
- Instance Unique ID
- Auto Match TF
- Timeframe - timeframe the Pivots, Supports and Resistances calculation is related to
- Select Pivot Type - 16 different formulas
- ATR Period - for the ATR formula or F11
- Show Central Pivot
- Show Level All - if set to false, allows to plot specific levels of Resistances and Supports
- Show Level (1 to 9) - 1 means Resistance 1 and Support 1 together, 2 means Resistance 2 and Support 2 together, etc
- Select Channel Level - L1 is for channels connecting successive Resistances 1 and Supports 1, L2 for channels connecting successive Resistances 2 and Supports 2, etc
- R line width, style and color
- Pivot line width, style and color
- S line width, style and color
- Draw Channel or not
- Channel Count Periods - periods for which the Channels are drawn on chart
- Channel Border width, style and color
- Channel Central width, style and color
- Channel Upper Color
- Channel Lower Color
- Draw Pivot Price Tag
- Pivot Price Tag Color
- Pivot Price Tag Count Periods - periods for which the Pivot, Resistance and Support Price Tags are drawn on charts
- Draw Suggested SL/TP Price Tag
- Price Tag Color Up
- Price Tag Color Down
- Suggested Price Tag Count Periods - periods for which the Suggested Price Tags are drawn on chart
- Draw mids 1st/2nd and 2nd levels - applicable only for the Classic formula or F1
- Upper Rect Color - Classic formula upper rectangle color
- Lower Rect Color - Classic formula lower rectangle color
- Count Periods - periods for which the rectangles are drawn (Classic formula)
