Time And Sales Layout
- Indicatori
- Stanislav Korotky
- Versione: 1.2
- Aggiornato: 18 aprile 2020
- Attivazioni: 5
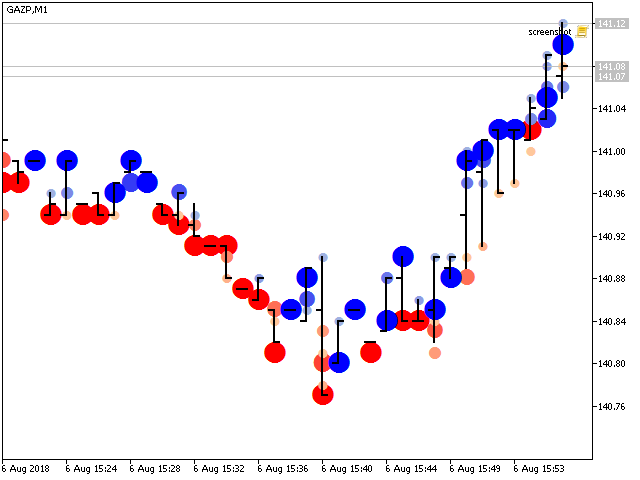
Time And Sales Layout indicator shows traded buy and sell volumes right on the chart. It provides a graphical representation of most important events in the time and sales table.
The indicator downloads and processes a history of real trade ticks. Depending from selected depth of history, the process may take quite some time. During history processing the indicator displays a comment with progress percentage.
When the history is processed, the indicator starts analyzing ticks in real time. The last bar data is updated.
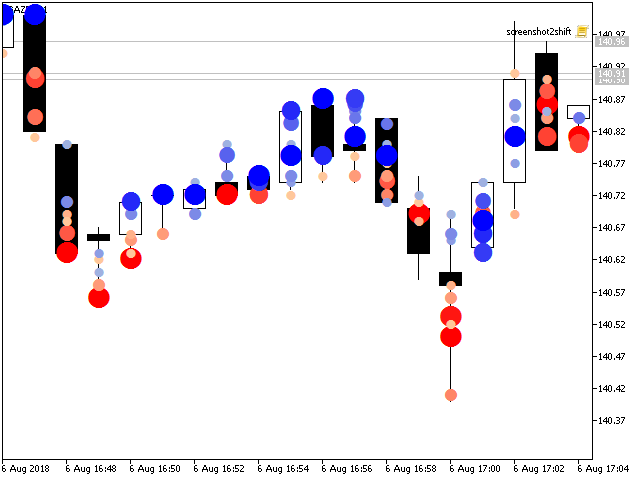
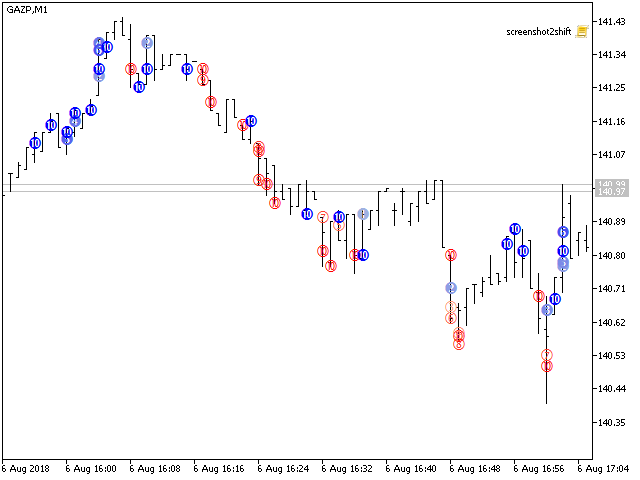
The indicator displays color marks where most significant volumes were traded, for buys and sells separately.
The indicator is primarily intended for intraday use, minute timeframes are recommended.
Parameters
- ShowHistoryFrom - a date to start tick history analysis, by default - 0, which means last day; please note that 0 for datetime type is shown in MetaTrader's UI as 1970.01.01 00:00:00 by design;
- Threshold - minimal volume of a single trade to take into account; use this parameter to filter out small trades and show only large ones;
- CharCode - a character code to display indicator's marks; it can be any symbol from the Wingdings font or -1; by default -1, which means that numeric bullets with values from 1 to 10 are displayed, denoting relative volume size;
- CharSize - defines the size of marks ("width" of indicator buffers); by default -1 (which means that the sizes vary proportinal to volumes), can be a value from 1 to 5;
- ColorPositive, ColorPositiveSmall - color gradient for buy volumes;
- ColorNegative, ColorNegativeSmall - color gradient for sell volumes;

