Cosmic Diviner Skyline Levels
- Indicatori
- Olena Kondratenko
- Versione: 1.1
- Aggiornato: 23 luglio 2018
- Attivazioni: 8
Cosmic Diviner Skyline Levels is an author's indicator of support and resistance levels, displays strong trading levels in the order of their importance, provides recommended entry points for Buy and Sell.
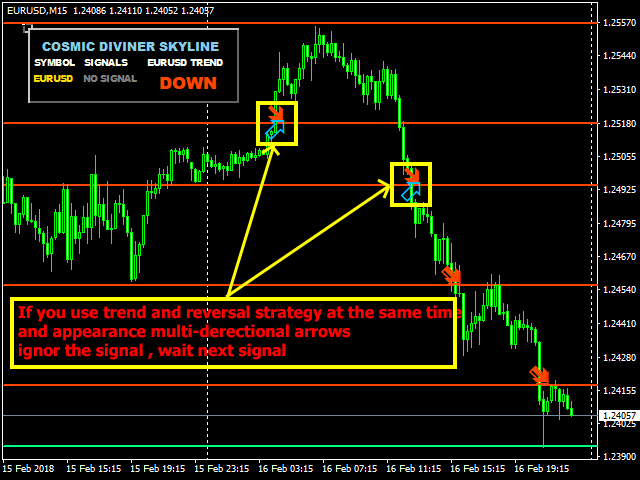
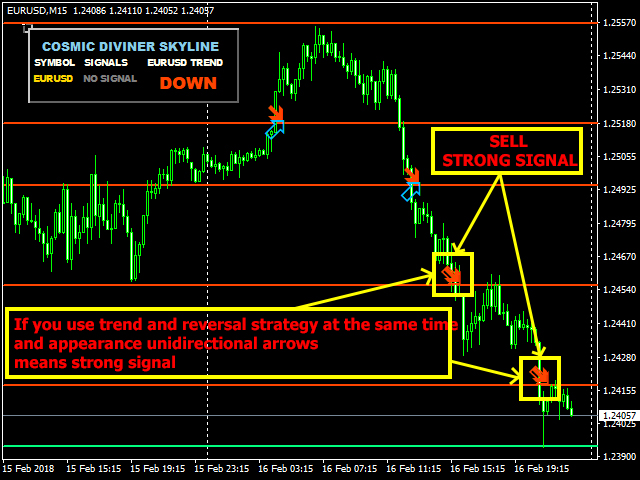
The indicator is equipped with filters to read current trends and displays the signals for Buy and Sell on two strategies - the strategy of trading in the direction of the trend and the strategy of trading on trend reversals. The displayed levels of support and resistance are at the same time recommended points for installing Take Profit and Stop Loss.
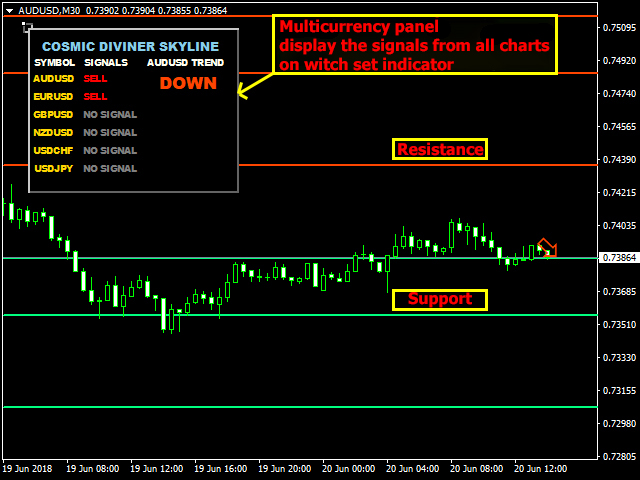
If the price of resistance levels is reached, they automatically become support levels and are painted green, and vice versa, in case of breakdown at the price of support levels, they become resistance levels and are painted red.
Full description of the indicator Cosmic Diviner Skyline Levels - https://www.mql5.com/en/blogs/post/719170
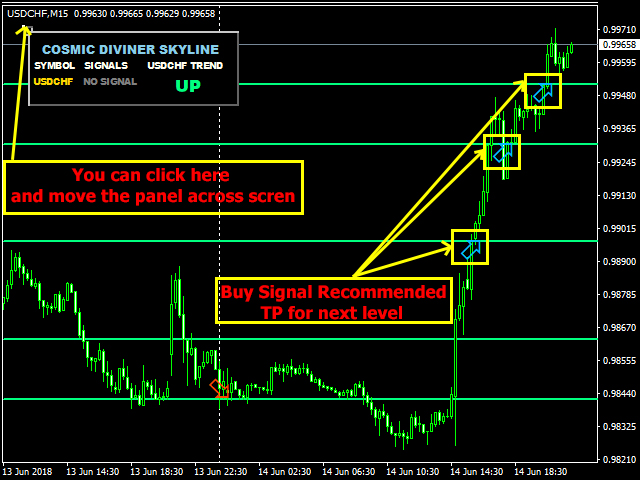
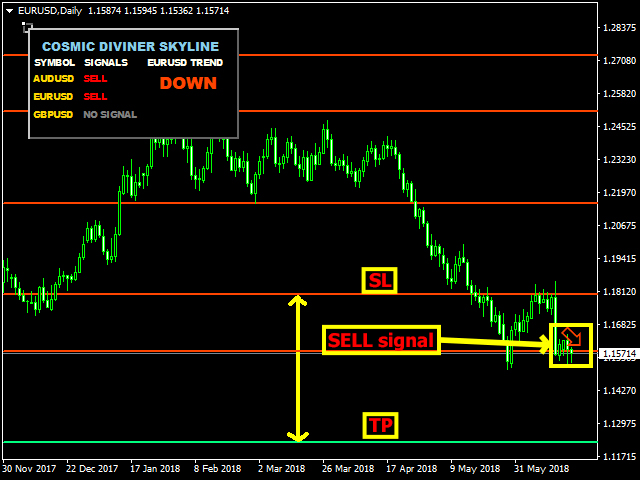
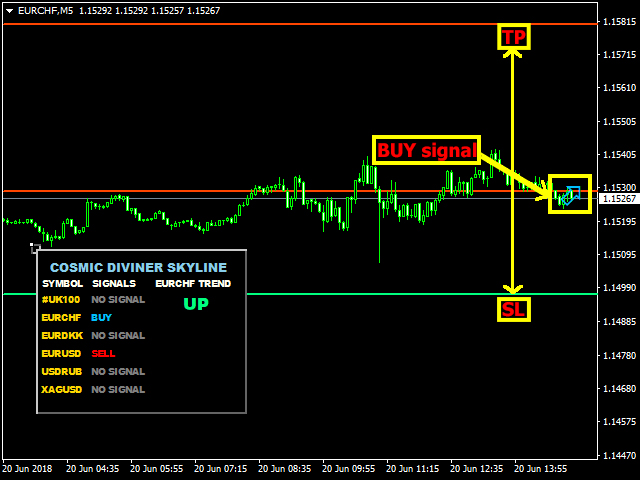
The advantage of the Skyline Levels indicator is the presence of an information panel in which the user can see the current information on potential entry points simultaneously on all trading instruments, on which the indicator is installed.
Recommendations
Skyline Levels is a multicurrency indicator suitable for working with any brokers.
The recommended trading period is M15.
Options for using strategies
Strategy Trend Signals
- Red horizontal levels on the chart are resistance levels.
- Green horizontal levels on the chart - support levels.
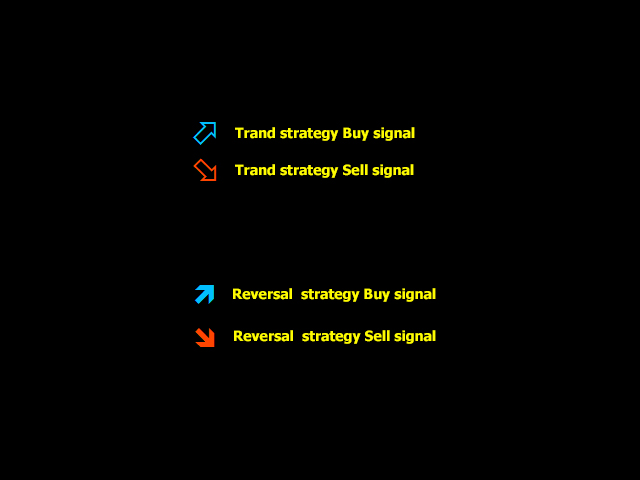
Buy signal - the arrow pointing upwards, the color is blue transparent inside.
- After the signal for the purchase appears, open the Buy order.
- Take Profit set at the next resistance level.
- Stop Loss set at the nearest support level.
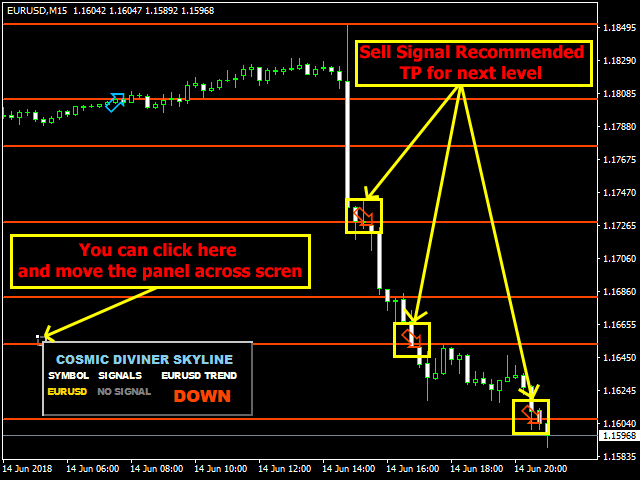
Sell signal - the arrow pointing down, the color is red transparent inside.
- After the appearance of the sell signal, open the Sell order.
- Take Profit established at the next level of support.
- Stop Loss set at the nearest resistance level.
Strategy Reversal Signals
- Red horizontal levels on the chart are resistance levels.
- Green horizontal levels on the chart - support levels.
Buy signal - the arrow pointing up, the color blue is painted inside.
- After the appearance of a buy signal, open a Buy order.
- Take Profit set at the next resistance level.
- Stop Loss set at the nearest support level.
Sell signal - the arrow pointing down, the color red is painted inside.
- After the appearance of the sell signal, open the Sell order.
- Take Profit set at the next support level.
- Stop the Loss set at the nearest resistance level.
Settings
Main indicator options
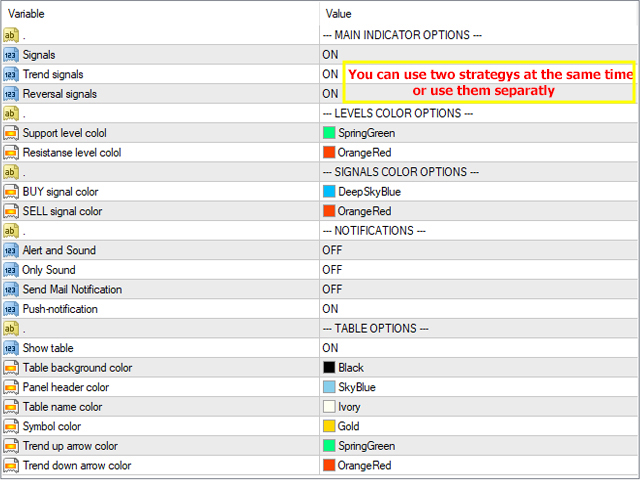
- Signals (ON/OFF) - display signals on the chart.
- Trend signals (ON/OFF) - use trend signals.
- Reversal signals (ON/OFF) - use reversal signals.
Levels color options
- Support level colol - settings of support levels color.
- Resistanse level colol - settings of resistance levels color.
Signals color options
- BUY signal color - color for Buy.
- SELL signal color - color for Sell.
Notifications
- Alert and Sound - alert and sound (on/off).
- Only Sound - only sound.
- Send Mail Notification - send mail notification.
- Push-notification - send a push notification.
Table options
- Show table - show information panel.
- Table background color - table background color selection.
- Panel header color - panel header color selection.
- Table name color - table name color selection.
- Symbol color - symbol color selection.
- Trend up arrow color - trend up arrow color selection.
- Trend down arrow color - trend down arrow color selection.










nice indicator