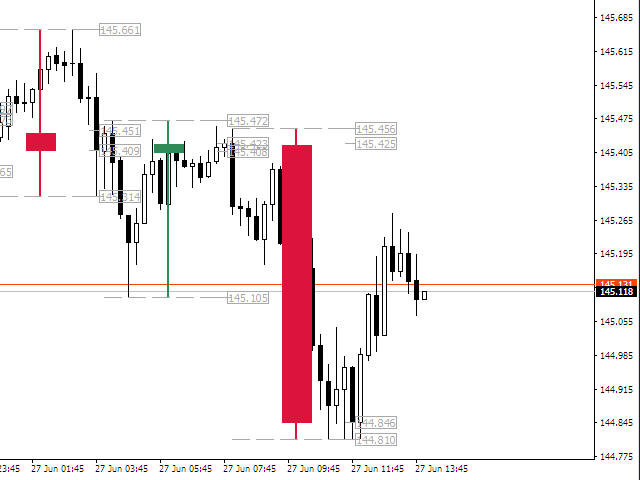
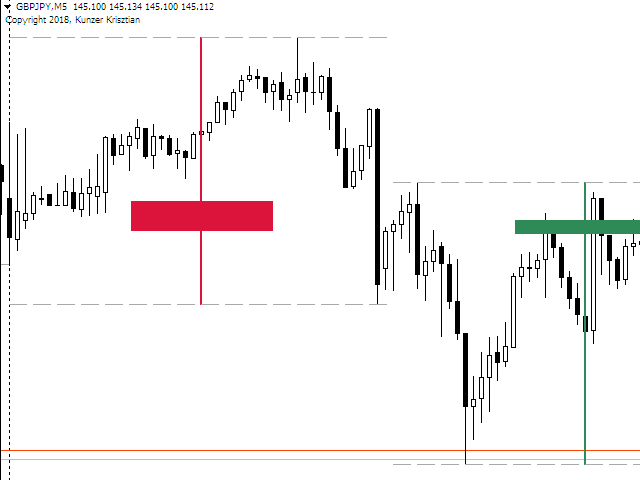
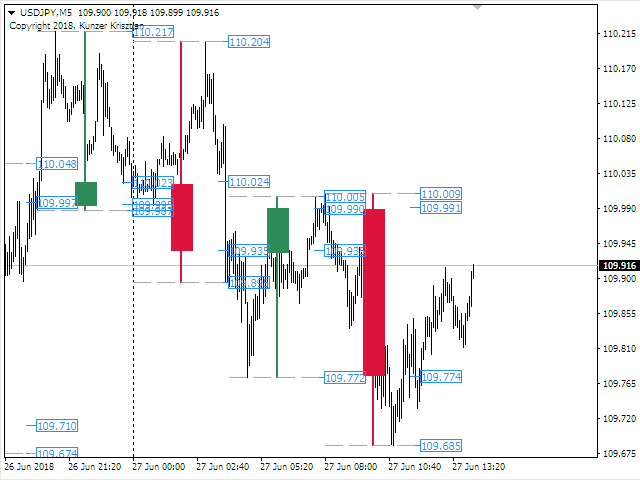
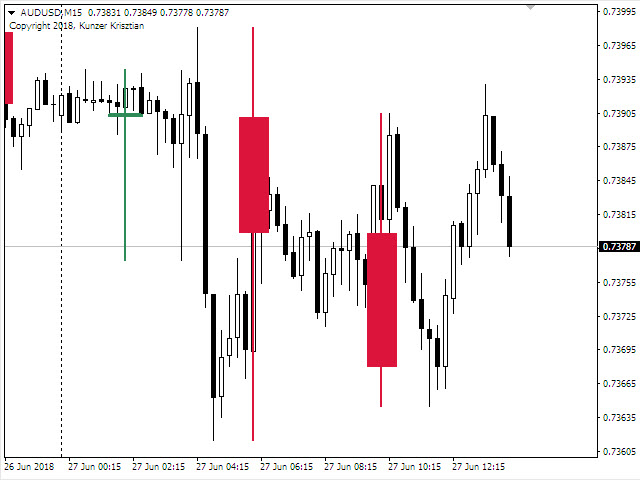
H4 candles on the lower timeframe charts
- Indicatori
- Krisztian Kunzer
- Versione: 1.0
- Attivazioni: 5
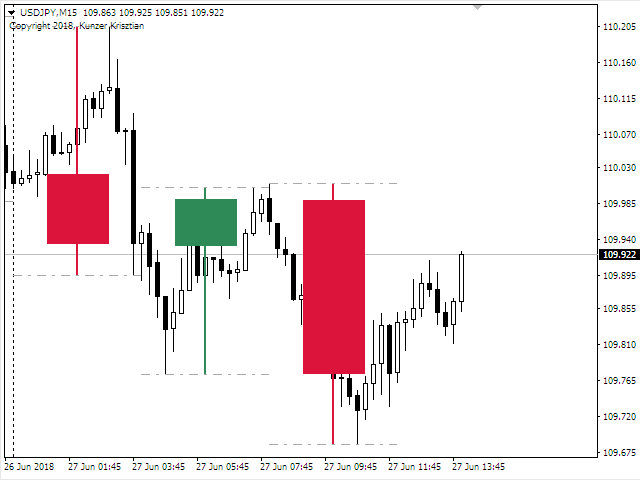
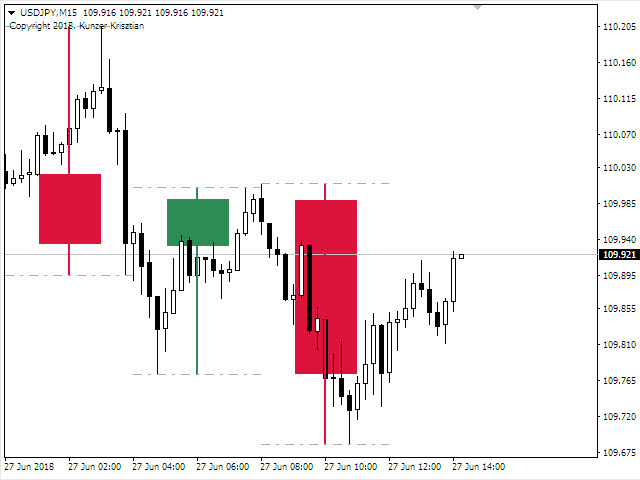
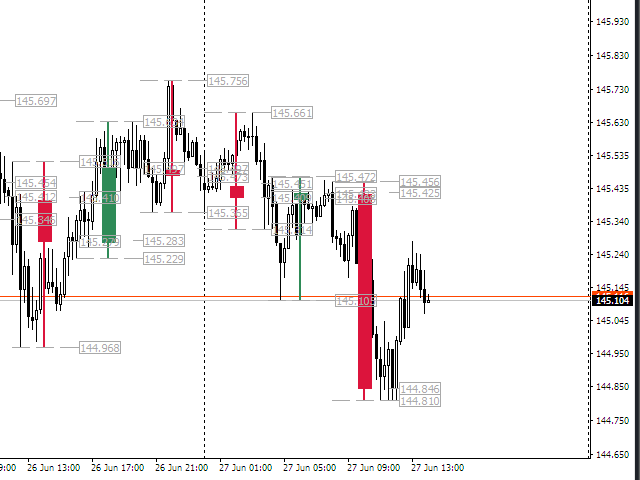
H4 candles on the lower timeframes indicator allows the user to display the four hour timeframe on the lower timeframe chart. The indicator shows the closed H4 candles on the chart. It does not show the last unclosed H4 candle. You can position and color the candles with or without price labels (High/Low/Open/Close of the four hour period) and High/Low lines. It can help to see the bigger picture if you are a day trader or scalper.
The most efficient way to use on the M5 and M15 charts, but you can use on the M1/M5/M15/M30/H1 timeframes.
On the H1 timeframe, please use the WidhtOfTheCandle = widht_4 value at least.
On the M30 timeframe, please use the WidhtOfTheCandle = widht_2 or widht_4 value.
Parameters
- Candle
- UpCandleColor - bullish candle color.
- DownCandleColor - bearish candle color.
- Candles_in_the_background - show the candles in the background.
- PositionOfTheCandle - position of the H4 candle.
- WidhtOfTheCandle - width of the body.
- WidhtOfTheWick - width of the wick.
- Price labels
- ShowPriceLabel - enable/disable the price labels on the chart.
- FontColor - color of the price labels.
- PriceLabelSize - size of the price labels.
- H4 high/low lines
- ShowHighLowH4Line - enable/disable the H4 High/Low lines on the chart.
- LineColor - color of the lines.
- LineSytle - style of the lines.
Please let me know about the features you like & I 'll add them in the next version.
Best Regards,
Krisztian Kunzer

