Zigzag Zotik
- Indicatori
- Andrei Belous
- Versione: 1.0
- Attivazioni: 5
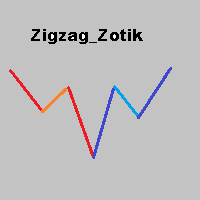
The Zigzag Zotik indicator displays the price movement in the form of a zigzag based on the AO_Zotik indicator values.
The Zigzag Zotik indicator displays the trend movements and their corrections.
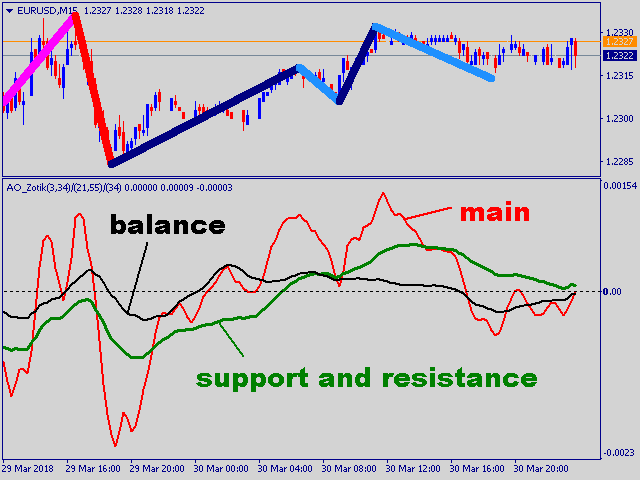
The AO_Zotik indicator consists of three lines moving relative to "0":
- "main" line;
- "support and resistance" line;
- "balance" line.
- The "main" line crossing the "support and resistance" line indicates the end of one wave and the beginning of the other. The Zigzag Zotik indicator displays this on the chart by changing the direction of zigzag.
- If the "support and resistance" line is above "0", then there is an ascending movement. The Zigzag Zotik indicator displays this on the chart using a trend line of one color.
- If the "support and resistance" line is below "0", then there is a descending movement. The Zigzag Zotik indicator displays this on the chart using a trend line of a different color.
- If the "support and resistance" line is above "0", and the "main" line crosses the "support and resistance" and the "balance" line downwards, then there is a correction to this upward movement. The Zigzag Zotik indicator displays this on the chart using a trend line of a different color.
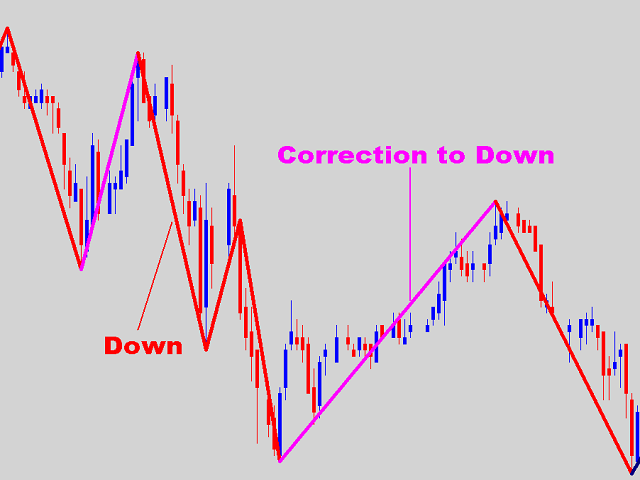
- If the "support and resistance" line is below "0", and the "main" line crosses the "support and resistance" and the "balance" line upwards, then there is a correction to this downward movement. The Zigzag Zotik indicator displays this on the chart using a trend line of a different color.
Indicator Parameters
- NumberOfBars - amount of calculated bars.
- width - width of the zigzag lines.
- i_colUp - color of the ascending movement.
- i_colDown - color of the descending movement.
- i_colUpCor - color of the corrective ascending movement.
- i_colDownCor - color of the corrective descending movement.





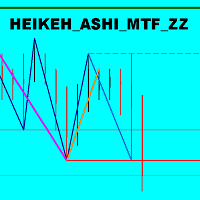
Мені дуже подобається, 5 зірок! Але... Можна було б його зробити мтф і щоб його можливо було застосовувати одразу 2 індикатори на одному графіку, щоб вони показували той таймфрейм що я використовую та старший таймфрейми одночасно на одному графіку.