• Panoramica
  • Recensioni (1)
  • Commenti (1)
  • Novità

Three simple lines

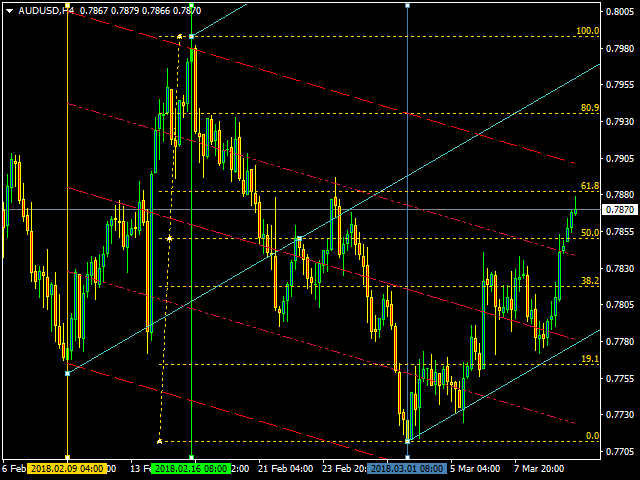
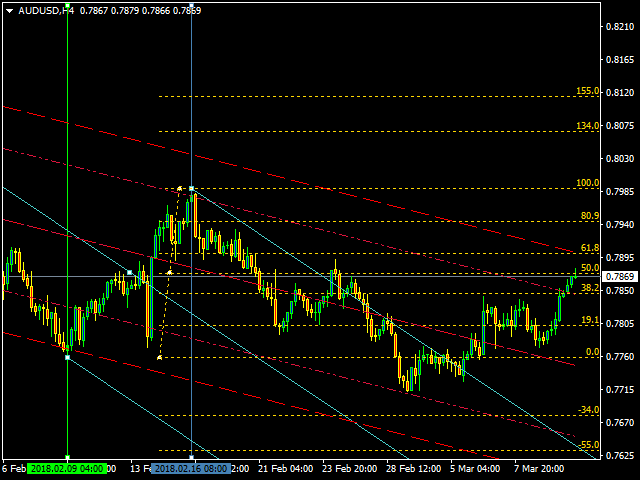
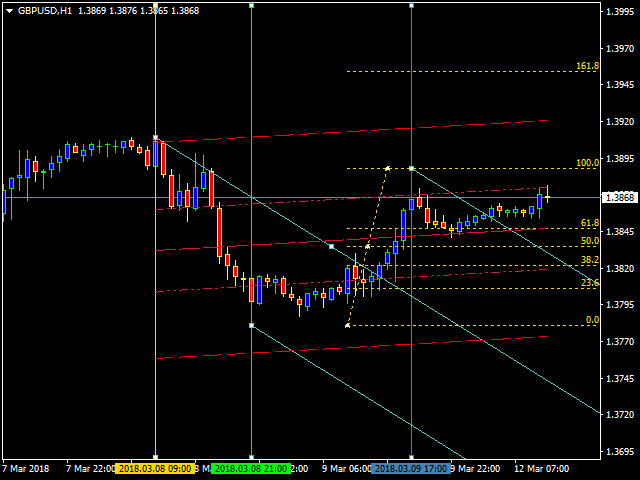
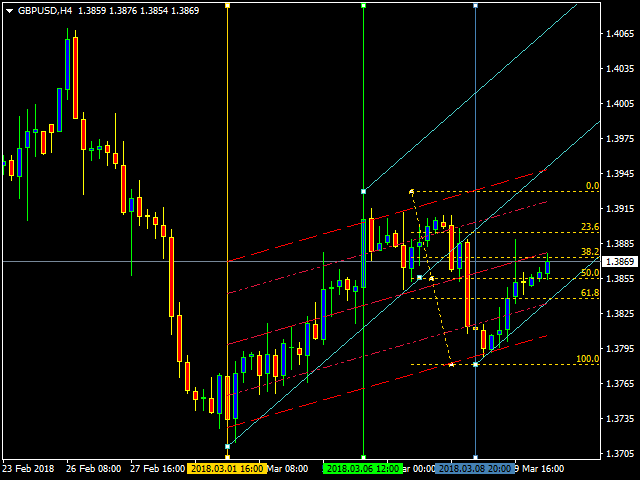
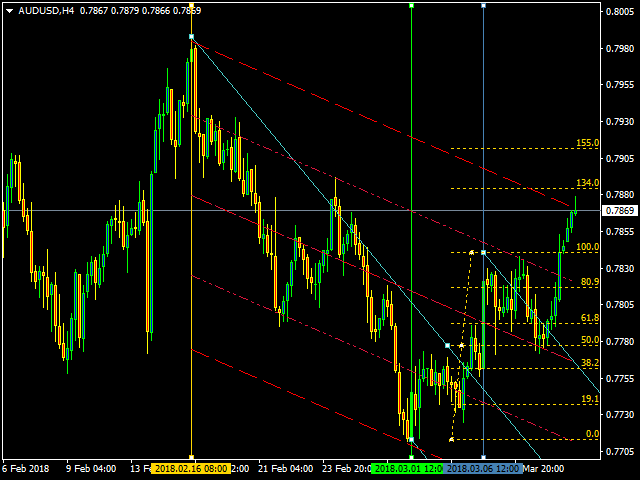
This is an individual tool for analyzing the market situation. It is very simple to use. After attaching the indicator to the chart, you will see three vertical lines named "VLine 1", "VLine 2" and "VLine 3", following in this order from left to right. For the utility to operate correctly, this sequence should always be observed. Please note: at the first start, the lines are not bound to specific price levels on the chart. This should be done by user in accordance with the following rule: if line 1 is set to identify a bottom, the line 2 should be set at the top, and line 3 should be placed similar to the first one, at the bottom. This is similar to a LOW-HIGH-LOW zigzag. In case a top at the line 1 is selected as the start, the sequence should be: HIGH-LOW-HIGH. The advantage of this approach is that users define the tops and bottoms for analyzing the market situation themselves. The indicator is equipped with the ability to plot such graphical tools as Andrews pitchforks, two types of Fibonacci levels, as well as linear regression and standard deviation channels. Each section of indicator parameters has a corresponding label, and the settings are reduced to the minimum required for their display.


Parameters

  • ___| Line — vertical line display section:
  • Line 1 Color — color of line 1.
  • Line 2 Color — color of line 2.
  • Line 3 Color — color of line 3.
  • Line Style — line display style.
  • Line Thickness — line width.
  • Delete lines? — delete the lines when the timeframe is changed or when the indicator is removed.
  • ___| Pitchfork — Andrews' Pitchfork display section:
  • Fitting Pitchfork — plot Andrews' Pitchfork, enabled by default.
  • Color Pitchfork — color of Andrews' Pitchfork.
  • ___| Fibo — Fibonacci level display section:
  • Inclusion levels Fibo — plot Fibonacci levels, enabled by default.
  • Installing Fibo levels — plot type: standard (default) or Bobokus.
  • Distance pips to turn Fibo levels — the minimum profit in pips required for plotting, default is 60.
  • Color Fibo Levels — color of Fibonacci levels.
  • ___| Linear Regression Channel — linear regression channel display section:
  • Inclusion Linear Regression Channel — plot linear regression channel, enabled by default.
  • Channel color — channel line color.
  • Style of channel lines — channel line style.
  • Width of channel lines — channel line width.
  • Channel's continuation to the right — extend the channel to the right, disabled by default.
  • ___| Standard Deviation Channel — standard deviation channel display section:
  • Standard Deviation Channel - plot standard deviation channel, enabled by default.
  • Deviation — deviation, default is 1.0;
  • Channel color — channel line color.
  • Style of channel lines — channel line style.
  • Width of channel lines — channel line width.
  • Channel's continuation to the right — extend the channel to the right, disabled by default.
Prodotti consigliati
Introduction to X3 Chart Pattern Scanner X3 Cherart Pattern Scanner is the non-repainting and non-lagging indicator detecting X3 chart patterns including Harmonic pattern, Elliott Wave pattern, X3 patterns, and Japanese Candlestick patterns. Historical patterns match with signal patterns. Hence, you can readily develop the solid trading strategy in your chart. More importantly, this superb pattern scanner can detect the optimal pattern of its kind. In addition, you can switch on and off individu
Automatic, live & interactive picture of all trendlines. Assign push, email and sound alerts to the lines of your choice and be informed about price rollback, breakout, rollback after breakout, number of rollbacks, line expiration by double breakout. Correct, drag or delete the lines and interactively tune the line system. https://youtu.be/EJUo9pYiHFA . Chart examples https: //www.mql5.com/en/users/efficientforex Price Interaction Events All events are effective immediately and only after on
PZ Harmonacci Patterns
PZ TRADING SLU
3.17 (6)
Trade smarter, not harder: Empower your trading with Harmonacci Patterns Special Offer: Purchase now to receive free bonuses worth $165! (Read more for details) This is arguably the most complete harmonic price formation auto-recognition indicator you can find for the MetaTrader Platform. It detects 19 different patterns, takes fibonacci projections as seriously as you do, displays the Potential Reversal Zone (PRZ) and finds suitable stop-loss and take-profit levels. [ Installation Guide | Upda
Fx Levels Premium Indicator Support and Resistance are important concepts in trading. Fx Levels Premium was created to easily draw important levels of support and resistance for the active trader. The indicator will give you all important levels (support/resistance) to watch for a wide range of assets. Trading without these levels on your chart is like driving a car for a long journey without a roadmap. You would be confused and blind. Support and resistance levels should be used as guidel
Trend Ray
Andriy Sydoruk
The indicator shows the potential trend direction by cyclical-wave dependence. Thus, all the rays of the intersection will be optimal rays, in the direction of which the price is expected to move, taking into account the indicator period. Rays can be used as a direction for potential market movement. But we must not forget that the approach must be comprehensive, the indicator signals require additional information to enter the market.
Chart Patterns Detect 15 patterns (Ascending Triangle, Descending Triangle, Rising Wedge, Falling Wedge, Bullish Flag, Bearish Flag, Bullish Rectangle, Bearish Rectangle Symmetrical triangle, Head and Shoulders, Inverted Head and Shoulders, Triple top, Triple Bottom, Double Top, Double Bottom) Use historical data to calculate the probability of each pattern to succeed (possibility to filter notification according to the chance of success) gives graphic indication about the invalidation level and
Mechanism : The EA opening trade base on the standard " Japanese CandleSticks Technical Analysis " and confirming the signal by various reversal zone define by "Divergence, Support and Resistance, and some common Indicators like Sto, Bollinger Band, MACD etc" under the CONFIRMATION INPUTS SETTINGS (True/false option). Lot Method: The EA is Implemented with fixed lot size and Auto lot base on specified Risk Management System base on the available account balance by some percent risk of that's. Tr
Magic EA MT4
Kyra Nickaline Watson-gordon
3 (1)
Magic EA is an Expert Advisor based on Scalping, Elliot Waves and with filters such as RSI, Stochastic and 3 other strategies managed and decided with the robot smartly. Large number of inputs and settings are tested and optimized and embedded in the program thus inputs are limited and very simple. Using EA doesn't need any professional information or Forex Trading Knowledge. EA can trade on all symbols and all time frames, using special and unique strategies developed by the author. The EA
WanaScalper MT4
Isaac Wanasolo
1 (1)
A scalping indicator based on mathematical patterns, which on average gives signals with relatively small SL, and also occasionally helps to catch big moves in the markets (more information in the video) This indicator has three main types of notifications: The first type warns of a possible/upcoming signal on the next bar The second type indicates the presence of a ready signal to enter the market/open a position The third type is for SL and TP levels - you will be notified every time price r
Gold Phoenix
Yaroslav Varankin
The perfect tool for Scalng in the Forex markets You can trade both from signal to signal and using take profit  The algorithm does not use Zigzag!  No redrawing!  This is a channel instrument that uses a moving average as a filter. Moving Average  There are 2 parameters for the settings Ma Period = 5 period Moving Average  Channel 1.0 distance of channel lines from the chart Price Signal Filter - calculation of signal opening and filter There is a complete set of Alert There is a multi-timefram
The Penta-O is a 6-point retracement harmonacci pattern which usually precedes big market movements. Penta-O patterns can expand and repaint quite a bit. To make things easier this indicator implements a twist: it waits for a donchian breakout in the right direction before signaling the trade. The end result is an otherwise repainting indicator with a very reliable trading signal. The donchian breakout period is entered as an input. [ Installation Guide | Update Guide | Troubleshooting | FAQ | A
Day Pattern
Oleksandr Martsynyshen
Description: - D ay Pattern - an indicator that helps to identify patterns of price changes for the development of trading algorithms and strategies. For whom this tool? - For developers of trading strategies and algorithms. - Medium- and long-term traders. Time frames H1-W1. Features of the indicator: - There is a function of exporting indicator values to a file of the csv format. - Using the information panel, you can conduct an express analysis of trading tool. - The indicat
"Adjustable Fractals" - è una versione avanzata dell'indicatore frattale, uno strumento di trading molto utile! Come sappiamo, l'indicatore standard di frattali mt4 non ha impostazioni, il che è molto scomodo per i trader Adjustable Fractals ha risolto questo problema, ha tutte le impostazioni necessarie: Periodo regolabile dell'indicatore (valori consigliati - superiori a 7) Distanza regolabile dai massimi/minimi del prezzo Design regolabile delle frecce frattali // Altri fantastici Expert
Perfect for one minutes high trading and scalping. This indicator is very effective for trading on one minutes, in the hour. A combination of moving averages and STOCHASTICS calculation to produce a very convincing signal every hour. Blue colour signals a buy opportunity. Follow the X signs for possible buy points. The Blue average line serves as possible trend direction and support. Red colour signals a sell opportunity. Follow the X signs for possible sell points. The Red average line serves a
EA Black Box
Vitali Vasilenka
️ Join our Telegram channel and get a powerful package of gifts that will make your trading even more successful: ️Our Telegram channel   ️     t.me/EAQuantumLab   3 unique indicators   - accurate market analysis in your hands.   Trading panel   - convenient management of all trades.   Expert Advisor   - your reliable assistant in automatic trading.   VIP-chat with signals   - trade together with professionals and use proven signals. ️   And all this is absolutely free! Jus
Introducing the "Magic Trades" for MetaTrader 4 – your ultimate tool for precision trading in dynamic markets. This innovative indicator revolutionizes the way you perceive market trends by harnessing the power of advanced analysis to detect subtle changes in character, paving the way for optimal trading opportunities. The Magic Trades Indicator is designed to empower traders with insightful entry points and well-defined risk management levels. Through its sophisticated algorithm, this indica
KT Renko Patterns MT4
KEENBASE SOFTWARE SOLUTIONS
2.33 (3)
KT Renko Patterns scans the Renko chart brick by brick to find some famous chart patterns that are frequently used by traders across the various financial markets. Compared to the time-based charts, patterns based trading is easier and more evident on Renko charts due to their uncluttered appearance. KT Renko Patterns features multiple Renko patterns, and many of these patterns are extensively explained in the book titled Profitable Trading with Renko Charts by Prashant Shah. A 100% automate
This is an arrow indicator without a future function,developed based on the most advanced profit trading algorithms.It has the most innovative and advanced dual trend analysis module, as well as the latest and highly effective market trend prediction algorithm.Trends are your friends, and following larger trends can earn the maximum profit in foreign exchange. This indicator helps traders identify current trends and track them. Someone once made a profit of 10 times in a week by relying on it.No
The indicator detects and displays 3 Drives harmonic pattern (see the screenshot). The pattern is plotted by the extreme values of the ZigZag indicator (included in the resources, no need to install). After detecting the pattern, the indicator notifies of that by a pop-up window, a mobile notification and an email. The indicator highlights the process of the pattern formation and not just the complete pattern. In the former case, it is displayed in the contour triangles. After the pattern is com
Price Breakout pattern Scanner is the automatic scanner for traders and investors. It can detect following patterns automatically from your chart. Head and Shoulder - Common tradable pattern. Reverse Head and Shoulder - This pattern is the reverse formation of the Head and Shoulder. Double Top - When the price hits resistance level twice and decline toward the support level, the trader can anticipate sudden bearish breakout through the support level. Double Bottom - The double bottom pattern is
Atomic Analyst
Issam Kassas
5 (2)
Innanzitutto, vale la pena sottolineare che questo indicatore di trading non è repaint, non è ridisegno e non presenta ritardi, il che lo rende ideale sia per il trading manuale che per quello automatico. Manuale utente: impostazioni, input e strategia. L'Analista Atomico è un indicatore di azione del prezzo PA che utilizza la forza e il momentum del prezzo per trovare un miglior vantaggio sul mercato. Dotato di filtri avanzati che aiutano a rimuovere rumori e segnali falsi, e aumentare il pote
KT Pin Bar
KEENBASE SOFTWARE SOLUTIONS
KT Pin Bar identifies the pin bar formation which is a type of price action pattern which depicts a sign of reversal or rejection of the trend. When combined with support and resistance, BRN and other significant levels, Pin Bar pattern proved to be a very strong sign of reversal. Basically, a pin bar is characterized by a small body relative to the bar length which is closed either in upper or lower 50% part of its length. They have very large wicks and small candle body. A pin bar candlest
As of January 1 , 2025 , the price will be $ 37.50 Best indicator for trend reversals Can be optimized for crypto trading or all currency pairs How to use:When the arrow appears, wait for the candle to close and open the order Level lines appear when candle closes,  The system shows you the best entry levels It is simple and easy to use, no additional settings are required. Best indicator for beginners and professionals You can set the displayed stop loss and desired profit levels. You can use
Fractal Zig Zag
Mikhail Nazarenko
A   professional version of the ZigZag indicator for visualizing the structure of price movements by fractals. Fractal ZigZag fixes the flaws of the standard version of the ZigZag indicator MT4. It uses Price action and a unique filtering algorithm to determine fractals. Suitable for all types of trading. Ideal for trading according to the WM pattern "Sniper" strategy !!! Features Marks the place of price reversal during the formation of a new fractal with specified parameters. Suitable for
VR Cub
Vladimir Pastushak
VR Cub è un indicatore per ottenere punti di ingresso di alta qualità. L'indicatore è stato sviluppato per facilitare i calcoli matematici e semplificare la ricerca dei punti di ingresso in una posizione. La strategia di trading per la quale è stato scritto l'indicatore ha dimostrato la sua efficacia per molti anni. La semplicità della strategia di trading è il suo grande vantaggio, che consente anche ai trader alle prime armi di commerciare con successo con essa. VR Cub calcola i punti di apert
The   True Magic Oscillator   indicator is designed for signal trading. This indicator generates trend signals. It uses many algorithms and indicators to generate this signal. It tries to generate signals from the points with the highest trend potential. This indicator is a complete trading product. This indicator does not need any additional indicators. The indicator is never repainted. The point at which the signal is given does not change.         Features and Recommendations Wor
NOTE: PRICE WILL RISE VERY SOON. DON'T SKIP THIS OFFER! Dear traders I am glad to introduce the " Market Swing Scanner Board" indicator to you. This indicator was made mainly to be used in combination with the Market Swing Index Indicator. You use the  "Market Swing Scanner Board"  indicator to scan for trading opportunities on the  Market Swing Index Indicator . This tool is designed for serious traders who have decided to make a difference through trading. Be the next person to witness this st
Automated Trendlines
Georgios Kalomoiropoulos
5 (16)
Le linee di tendenza sono lo strumento più essenziale di analisi tecnica nel forex trading. Sfortunatamente, la maggior parte dei trader non li disegna correttamente. L'indicatore automatizzato delle linee di tendenza è uno strumento professionale per i trader seri che ti aiuta a visualizzare il movimento di tendenza dei mercati. Esistono due tipi di linee di tendenza, linee di tendenza rialziste e linee di tendenza ribassiste. Nella tendenza rialzista, la linea di tendenza Forex viene t
This indicator works on MT4 and is very easy to use. When you receive a signal from it, you wait for that candle with the signal to close and you enter your trade at the beginning of the next new candle . A red arrow means sell and a green arrow means buy. All arrows comes with Alert  like for easy identification of trade signal. Are you okay with that? 1 minute candle 1 minute expire
FreqoMaster
Stanislav Korotky
The main idea of this indicator is rates analysis and prediction by Fourier transform. The indicator decomposes exchange rates into main harmonics and calculates their product in future. The indicator shows 2 price marks in history, depicting price range in the past, and 2 price marks in future with price movement forecast. Buy or sell decision and take profit size are displayed in a text label in the indicator window. The indicator uses another indicator as an engine for calculations - FreqoMet
Gli utenti di questo prodotto hanno anche acquistato
Trade Assistant MT4
Evgeniy Kravchenko
4.44 (180)
It helps to calculate the risk per trade, the easy installation of a new order, order management with partial closing functions, trailing stop of 7 types and other useful functions. Attention, the application does not work in the strategy tester. Manual, Description, Download demo Line function -   shows on the chart the Opening line, Stop Loss, Take Profit. With this function it is easy to set a new order and see its additional characteristics before opening.   Risk management  - The risk
Forex Trade Manager MT4
InvestSoft
4.98 (376)
Benvenuto a Trade Manager EA, lo strumento definitivo per la gestione del rischio , progettato per rendere il trading più intuitivo, preciso ed efficiente. Non è solo uno strumento per l'esecuzione degli ordini, ma una soluzione completa per la pianificazione delle operazioni, la gestione delle posizioni e il controllo del rischio. Che tu sia un principiante, un trader avanzato o uno scalper che necessita di esecuzioni rapide, Trade Manager EA si adatta alle tue esigenze, offrendo flessibilità s
Local Trade Copier EA MT4
Juvenille Emperor Limited
5 (83)
Sperimenta una copia di trading eccezionalmente veloce con il Local Trade Copier EA MT4 . Con la sua facile configurazione in 1 minuto, questo copiatore di trading ti consente di copiare i trades tra diversi terminali di MetaTrader sullo stesso computer Windows o su Windows VPS con velocità di copia ultra veloci inferiori a 0.5 secondi. Che tu sia un trader principiante o professionista, Local Trade Copier EA MT4 offre una vasta gamma di opzioni per personalizzarlo alle tue esigenze specifiche.
Fai trading automaticamente su zone di supporto e resistenza o di domanda e offerta una volta identificate le aree chiave da cui vuoi fare trading. Questo EA ti consente di disegnare zone di acquisto e vendita con un solo clic e poi posizionarle esattamente dove ti aspetti che il prezzo cambi. L'EA monitora quindi quelle zone e farà trading automaticamente in base all'azione del prezzo che specifichi per le zone. Una volta che il trading iniziale è stato eseguito, l'EA uscirà in profitto nella
Trade Dashboard MT4
Fatemeh Ameri
5 (41)
Tired of complex order placement and manual calculations? Trade Dashboard is your solution. With its user-friendly interface, placing orders becomes effortless, by a single click, you can open trades, set stop loss and take profit levels, manage trade lot size, and calculate risk to reward ratios, allowing you to only focus on your strategy. Say goodbye to manual calculations and streamline your trading experience with Trade Dashboard. Download  Demo Version  right now. You can find  Details
The product will copy all telegram signal to MT4   ( which you are member  ) , also it can work as remote copier.  Easy to set up, copy order instant, can work with almost signal formats, image signal, s upport to translate other language to English Work with all type of channel or group, even channel have "Restrict Saving Content", work with  multi channel, multi MT5 Work as remote copier: with signal have ticket number, it will copy exactly via ticket number. Support to backtest signal. How to
Exp COPYLOT CLIENT for MT4
Vladislav Andruschenko
4.69 (62)
Copiatore commerciale per MetaTrader 4.       Copia le operazioni, le posizioni e gli ordini forex da qualsiasi conto. È uno dei migliori copiatori commerciali       MT4 - MT4, MT5 - MT4       per il       COPYLOT MT4       versione (o       MT4 - MT5 MT5 - MT5       per il       COPYLOT MT5       versione). Versione MT5 Descrizione completa   +DEMO +PDF Come comprare Come installare     Come ottenere i file di registro     Come testare e ottimizzare     Tutti i prodotti di Expforex Versio
Telegram To MT4 Receiver
Levi Dane Benjamin
5 (4)
Copia i segnali da qualsiasi canale di cui sei membro (inclusi quelli privati e restrittivi) direttamente sul tuo MT4.  Questo strumento è stato progettato con l'utente in mente offrendo molte funzionalità necessarie per gestire e monitorare le negoziazioni. Questo prodotto è presentato in un'interfaccia grafica facile da usare e visivamente attraente. Personalizza le tue impostazioni e inizia a utilizzare il prodotto in pochi minuti! Guida dell'utente + Demo  | Versione MT5 | Versione Discor
Trade Manager MT4 DaneTrades
Levi Dane Benjamin
4.33 (9)
Trade Manager per aiutarti a entrare e uscire rapidamente dalle operazioni calcolando automaticamente il tuo rischio. Incluse funzionalità che ti aiutano a prevenire l'eccessivo trading, il vendetta trading e il trading emotivo. Le operazioni possono essere gestite automaticamente e i parametri di performance del conto possono essere visualizzati in un grafico. Queste caratteristiche rendono questo pannello ideale per tutti i trader manuali e aiuta a migliorare la piattaforma MetaTrader 4. Suppo
Il MT4 to Telegram Signal Provider è uno strumento facile da usare e completamente personalizzabile che consente l'invio di segnali a Telegram, trasformando il tuo account in un fornitore di segnali. Il formato dei messaggi è completamente personalizzabile! Tuttavia, per un uso semplice, puoi anche optare per un modello predefinito e abilitare o disabilitare parti specifiche del messaggio. [ Dimostrativo ]  [ Manuale ] [ Versione MT5 ] [ Versione Discord ] [ Canale Telegram ] Configurazione È
ADAM for FTMO 40
Vyacheslav Izvarin
5 (1)
ADAM EA Special Version for FTMO  Our 1st EA created using ChatGPT technology Trade only GOOD and checked PROP FIRMS  Default parameters for Challenge $100,000 Tested on EURUSD and GBPUSD only  Use 15MIN Time Frame Close all deals and Auto-trading  before Weekend at 12:00 GMT+3  Friday For Prop Firms MUST use special Protector  https://www.mql5.com/en/market/product/94887 ---------------------------------------------------------------------------------------------------------------------------
Grid Manual MT4
Alfiya Fazylova
4.71 (17)
Grid Manual è un pannello di trading per lavorare con una griglia di ordini. L'utilità è universale, ha impostazioni flessibili e un'interfaccia intuitiva. Funziona con una griglia di ordini non solo nella direzione delle perdite, ma anche nella direzione dell'aumento dei profitti. Il trader non ha bisogno di creare e mantenere una griglia di ordini, lo farà l'utilità. È sufficiente aprire un ordine e il manuale di Grid creerà automaticamente una griglia di ordini per esso e lo accompagnerà fino
Custom Alerts MT4
Daniel Stein
5 (2)
Rimanete al passo con i movimenti del mercato con gli avvisi personalizzati: Il vostro scanner multimercato per eccellenza Custom Alerts è il potente strumento di monitoraggio del mercato all-in-one che vi permette di identificare con facilità setup ad alto potenziale su più mercati. Coprendo tutte le otto principali valute (USD, CAD, GBP, EUR, CHF, JPY, AUD, NZD), l'oro (XAU) e fino a sette indici chiave (tra cui US30, UK100, WTI e Bitcoin), Custom Alerts vi tiene aggiornati sui cambiamenti cr
Discord To MT4 Receiver
Levi Dane Benjamin
5 (1)
Copia i segnali da qualsiasi canale di cui sei membro (   senza la necessità di un Token Bot o Permessi di Amministratore  direttamente nel tuo MT4. È stato progettato con l'utente in mente offrendo molte delle funzionalità di cui hai bisogno Questo prodotto è presentato in un'interfaccia grafica facile da usare e visivamente attraente. Personalizza le tue impostazioni e inizia ad utilizzare il prodotto in pochi minuti! Guida Utente + Demo  | Versione MT5 | Versione Telegram Se desideri prova
Prendi il controllo del tuo portafoglio forex. Vedi istantaneamente dove ti trovi, cosa sta funzionando e cosa ti sta causando dolore! VERSIONE MT5 DISPONIBILE QUI: https://www.mql5.com/en/market/product/58658 Il dashboard di Trade Manager è progettato per mostrarti a colpo d'occhio dove si trova attualmente ogni posizione che hai nel mercato forex e rendere più facile la comprensione della gestione del rischio e dell'esposizione alle valute. Per i trader che scalano gradualmente il mercato c
VirtualTradePad mt4 Extra
Vladislav Andruschenko
4.88 (57)
Pannello di trading per il trading in 1 clic.   Lavorare con posizioni e ordini!   Trading dal grafico o dalla tastiera. Utilizzando il nostro pannello di trading, puoi fare trading con un clic dal grafico ed eseguire operazioni di trading 30 volte più velocemente rispetto al controllo MetaTrader standard. Calcoli automatici di parametri e funzioni che semplificano la vita di un trader e lo aiutano a condurre le proprie attività di trading in modo molto più rapido e conveniente. Suggerimenti gr
MT4 To Telegram Sender
Levi Dane Benjamin
3.5 (4)
Invia segnali completamente personalizzabili da MT4 a Telegram e diventa un fornitore di segnali! Questo prodotto è presentato in un'interfaccia grafica facile da usare e visivamente accattivante. Personalizza le tue impostazioni e inizia a utilizzare il prodotto in pochi minuti! Guida utente + Demo  | Versione MT5  | Versione Discord Se desideri provare una demo, consulta la Guida utente. L'invio da MT4 a Telegram NON funziona nel tester di strategia. Caratteristiche di MT4 a   Telegram P
The News Filter
Leolouiski Gan
5 (24)
Questo prodotto filtra tutti gli esperti consulenti e i grafici manuali durante il periodo delle notizie, così non dovrai preoccuparti di improvvisi picchi di prezzo che potrebbero distruggere le tue impostazioni di trading manuali o le negoziazioni effettuate da altri esperti consulenti. Questo prodotto viene fornito anche con un sistema completo di gestione degli ordini che può gestire le tue posizioni aperte e gli ordini in sospeso prima della pubblicazione di qualsiasi notizia. Una volta che
TradePanel MT4
Alfiya Fazylova
4.9 (86)
Trade Panel è un assistente commerciale multifunzionale. L'applicazione contiene più di 50 funzioni di trading per il trading manuale e consente di automatizzare la maggior parte delle operazioni di trading. Attenzione, l'applicazione non funziona nel tester di strategia. Prima dell'acquisto, puoi testare la versione demo su un conto demo. Versione demo qui . Istruzioni complete qui . Commercio. Ti consente di eseguire operazioni di trading con un clic: Apri ordini e posizioni pendenti con calco
News Trapper EA
Noha Mohamed Fathy Younes Badr
4.86 (14)
Hi, all.  News trapper EA It is an expert for trading news very safe expert  Automated Trading on the news of the economic calendar. It shows stable trading during last 10  years. EA doesn't use dangerous technologies like martingale, grid. The Expert is very simple to use.      sale will end after 48 h how to install it     and set files     read the blog         after purchase contact me to add you to   VIP   channel  The program contains flexible settings for trading on the news of the econ
Strumento Darwin Reports EA Prezzo di lancio eccezionale!    35 USD DESCRIZIONE: Darwin Reports Tool EA è il nuovo prodotto della gamma Darwin. I prodotti Darwin sono ben noti e rinomati su MQL5 per la loro qualità e le loro prestazioni. Questa volta non vi propongo un Expert Advisor, ma un'utility destinata ad automatizzare le attività. In sostanza, per fare i resoconti delle vostre prestazioni SPIEGAZIONI : Infatti, grazie a questa utility, sarete in grado di inviare qua
Layer Master Toolbox
Peter Andrew Thomas
5 (4)
GRID TRADING - Layer Master tool kit is the ultimate, easy to use trading toolkit makes it simple to layer grids of Orders over any entry level. This toolkit will make it simple and fast to Open / Enter and Manage your grid trades on MT4. Every function is simple - but clicking and dragging the order zone - you define an area you want your orders, then you can quickly drag the SL and TP levels to where you want them. Hit one button and your orders are sent!!!  Features: It is capable to send h
Auto Trade Driver
Vu Trung Kien
4.87 (15)
Auto Trade Driver is an automatic powerful tool (run as Expert Advisor) that helps you to manage risk and control orders and maximize your profit in multi-protect/trailing-stop rules. This tool is very useful for both scalpers and trend followers. It not only calculates the trade risk exactly, but also protects and maximizes your profits in real-time. With this tool, the only thing you have to do is to enter trade by your own strategy, then it will auto-drive your position with exit strategy you
Trade Manager Assistant è un dashboard di trading professionale per la gestione avanzata degli ordini. Trade Assistant combina strumenti di gestione del rischio con funzionalità manuali avanzate per l'elaborazione degli ordini commerciali. Di seguito è riportato il collegamento alle   istruzioni complete per l'installazione. La gestione intelligente del rischio ti consente di calcolare automaticamente la dimensione ottimale del lotto in base al rapporto di rischio o all'importo fisso per operazi
Copiatrice->Interazione dell'interfaccia comoda e veloce, gli utenti possono utilizzarla subito       ->>>> Si consiglia di utilizzarlo su computer Windows o VPS Windows Caratteristiche: Impostazioni di copy trading diversificate e personalizzate: 1. È possibile impostare diverse modalità di lotto per diverse fonti di segnale 2. È possibile impostare diverse fonti di segnale per il copy trading forward e reverse 3. I segnali possono essere impostati con commenti 4. Se calibrare il lotto in base
Trade Assistant Pro 36 in 1
Makarii Gubaydullin
4.95 (19)
Questo è uno strumento multifunzionale: ha più da 65 funzioni, tra cui possiamo citare alcuni come: calcolatrice della dimensione del Lot, azione sui prezzi, rapporto R/R, gestore commerciale, zone di domanda e offerta Versione demo   |   Manuale d'uso   |   MT5 L'utilità non funziona nel tester di strategia: puoi scaricare la versione demo QUI per testare il prodotto. Se hai qualsiasi domanda / idea di miglioramento o anche nel caso di trovare un bug, ti prego di contattarmi appena possibile,
TakePropips TradePad Pro
Eric John Pajarillaga Aldana
5 (4)
TakePropips TradePad Pro include un potente gestore commerciale, un misuratore di forza valutaria, strumenti di rendicontazione dei conti, strumenti di gestione del rischio e molto altro! È uno dei più avanzati gestori e assistenti commerciali del forex che tu abbia mai incontrato! È la soluzione perfetta per i trader che desiderano un modo più efficiente di gestire le transazioni commerciali. Puoi scaricare il manuale utente sul nostro post sul blog:   https://www.mql5.com/en/blogs/post/751180
MACD Divergence Scanner is a multi-timeframe and multi-symbol dashboard and alert that checks all timeframes and symbols to find regular and hidden divergences between price chart and MACD indicator. This divergence scanner is integrated with support and resistance zones so you can check the MACD divergences in the most important areas of the chart to find trend reversals in the price chart. Download demo version   (works on M 1,M5,M30,W1   timeframes) Full description of scanner parameters ->  
Price Action Toolkit
LEE SAMSON
4.6 (5)
Il toolkit di azione sui prezzi EA è progettato principalmente per scalper, ma può essere utilizzato in tutti i periodi di tempo per entrare rapidamente nel mercato con il dimensionamento del lotto calcolato correttamente in base al livello di stop. ordini) e quindi regola gli stop e i take profit man mano che il mercato si muove. Per un elenco completo di tutte le funzionalità, le impostazioni e la strategia di best practice da utilizzare, fare clic qui: https://www.mql5.com/en/blogs/post/74
TPSpro Trade PRO
Roman Podpora
5 (4)
IN MODALITÀ TEST (nel tester), la funzionalità del pannello NON È ATTIVA. Abbiamo fornito solo una rappresentazione visiva del pannello stesso. Uno strumento in grado di calcolare istantaneamente la dimensione o il rischio della posizione in base a un determinato livello di stop loss è fondamentale sia per i trader professionisti che per i principianti. L'utilità di trading TRADE PRO fornisce calcoli rapidi e accurati, aiutandoti a prendere decisioni in condizioni di tempo limitato e maggiore
Altri dall’autore
This is a well-known ZigZag indicator. But it differs by the fact that its plot is based on values of the middle line which is set by a user. It can display Andrews’ Pitchfork and standard or Bobokus Fibo levels. NO REPAINTING. Parameters Period МА — middle line period. Default value is 34. Minimum value is 4. Maximum value is set at your discretion. Used to calculate price - base price to calculate the middle line. The averaging method - method of smoothing the middle line. Turning pitchfork
This is a well-known ZigZag indicator. But it differs by the fact that its plot is based on values of the middle line which is set by a user. It can display Andrews’ Pitchfork and standard or Bobokus Fibo levels. NO REPAINTING. Parameters Period МА — middle line period. Default value is 34. Minimum value is 4. Maximum value is set at your discretion. Used to calculate price — type of price used for the midline calculations. The averaging method — type of smoothing for the middle line. Turning
This is an interactive and easy-to-set indicator which allows to form seven equally spaced channels which have your settings simultaneously. All seven channels are enabled by default. But you can easily enable one or another channel using control buttons located in the upper case of the indicator's control panel. You can change a period of the indicator calculation by clicking one of buttons indicating number of the channel in the lower case of the control panel. Two other buttons (one of them i
This EA represents an interactive panel with adjustable parameters destined for installation and deletion of pending orders (orders grid generator). You can place the panel anywhere on the screen or hide it into a dot clicking on the button in the upper left part of the chart (it will be shown after clicking on it for the second time). Number and step of orders, lot size, vertical shift for limit orders - all these things make your work easier. There are functions for restoring according to pend
The purpose of the indicator is drawing an equidistant channel. It is somewhat different from the traditional model. The choice of control parameters is simple and does not require any special description. Enter the calculation interval in hours and the solution to the problem will appear on the screen. Please note that the time involved in calculation of the channel must be greater than the timeframe it will be displayed on. If the parameters you enter are beyond the allowable limits, you will
This indicator is designed for drawing equidistant channels. Two options are available: based on the number of hours in the indicator calculation and by the number of bars. To draw a channel, enter a number 1 or greater. The maximum value is limited by the amount of visible bars. If the parameters you enter are beyond the allowable limits, you will get notified if the indicator restrictions. Please note that the time involved in calculation of the channel must be greater than the timeframe it wi
The indicator displays the moving average of all periods on one chart. It shows the MA of a one step lower timeframe and all the MAs equal to and higher than it. Parameters Period moving average - Moving Average period (default is 34); Used to calculate price - price used for the MA calculation (default is the average price = (high+low)/2); The averaging method - default is linear-weighted; Moving average shift - MA shift (default is 0). Just enter the MA calculation period and its parameters,
This indicator is designed for analyzing your positions on 30 financial instruments with the font size of the output information between 8 and 10. If the font size is 11 you will see only 26 instruments and so on: 12-25, 13-24, 14-20. The font size can range from 8 to 14. The main window contains buttons with names of financial instruments and lines where brief information about all open positions is displayed. Two columns show the total volumes in lots of positions in each trading direction: BU
This is a prototype of the famous Control and management of transactions panel. There are two main differences: Allows to work with all the variety of financial instruments opened by a user and not only with instruments it was attached to; To activate levels of order closure hidden from a broker, it uses not lines but modifiable virtual levels. To enjoy the full functionality of the panel you are advised to have: Desk analytical table . Their combined operation allows to keep the situation under
This is a prototype of the famous Control and management of transactions panel. There are two main differences: Allows to work with all the variety of financial instruments opened by a user and not only with instruments it was attached to; To activate levels of order closure hidden from a broker, it uses not lines but modifiable virtual levels. The EA will independently determine a total number of involved financial instruments, display them in the upper left window and locate the pointer on the
It is widely known that colors affect the emotional state of a human, especially if this human is a trader. Psychologists recommend that you follow your instincts and select the color of your environment that is most comfortable to you. In order to reduce emotional stress, impact of colors on a person should be considered. The optimal range of the most beneficial colors includes green, yellow-green and green-blue ones. This indicator allows you to manage your emotional state and health. Choose a
The indicator is based on the two-buffer scheme and does not require any additional settings. It can be used on any financial instrument without any restrictions. The indicator is a known ZigZag, but it does not redraw . The indicator allows to easily detect significant levels on the price chart, as well as demonstrates the ability to determine the probable direction of a price movement. The calculations are based on the candles' Close prices, thus improving the reliability of the levels. Para
The idea of the indicator stems from the necessity to clearly define the borders of support and resistance levels, which helps to plan the opening and closing of positions in the areas that most appropriately determine the process. Look at the breakdowns of the resistance level that confirm the intention of the price to continue the upward movement, after it passed the support level and entered the channel formed by the two levels. The same is for the case when the price enters the channel downw
This indicator is a logical extension of the product at https://www.mql5.com/en/market/product/12526 . The only difference is that price movement is displayed using a histogram with levels, allowing to assess the direction and strength of the movement. How to interpret the signal: 0 - the middle of the channel; above 0.5 - the breakdown of the channel up; below -0.5 - the breakdown of the channel down. Both indicators are displayed in the attached screenshots. Install the indicator and you will
Simple Line
Valeriy Medvedev
The indicator shows the levels of the past week and day. In addition, it draws a level in percentage. This level is specified relative to the difference between the High and Low of the past month and week. For the daily levels of the past day, the Close levels are additionally displayed. All you need to do is configure the display parameters of the levels to your liking. Parameters Over the past months installations - settings for the last months; PasteMonthsLines - the level display mode is
This indicator is the logical continuation of the well-known equidistant channel indicator: https://www.mql5.com/en/market/product/8723 . The main purpose of the indicator is the visualization of price levels relative to the parallel channel using Fibo Bobokus levels in a separate window and the price history. This often allows forecasting the future price movement with a sufficiently high degree of probability. The Fibo levels calculation equation is as follows: FiboLevel = (50-(100*((Close[i]-
This simple to use utility allows opening charts from the list of financial instruments by left clicking their names. The chart window is opened using the Default template. The template name can be changed to one of those stored in Charts-Templates section of the terminal. It is possible to customize the background colors of panels and their labels, and also to select the display type for a more comfortable working environment. This is all you need to know in order to see the result quickly. P
Quick response
Valeriy Medvedev
If you need to quickly evaluate the results of trading on a current financial instrument by hypothetical price movement in the chosen direction and up to a certain level, set the indicator on any chart that contains open positions and move the line to the desired level after it appears together with the results tab. This is all you need to understand what happens to your deposit if the price is at this level without taking into account existing stop loss and take profit. Enable considering pendi
This indicator displays a set of moving average lines across all higher timeframes. The indicator can be installed on any financial instrument and any timeframe. For the analysis of the lines, a panel with timeframe values is provided in the lower right corner. Using the panel, you can easily enable/disable the display of the MA line of any higher timeframe. This allows a more thorough analysis of the market situation. The color of the button matches the color of the moving average line. Param
This indicator is designed for monitoring RSI levels on the current and higher timeframes. The control panel is user friendly and consists of buttons, with which you can control the display of lines as per the names of the buttons. The button color matches the line color. Parameters "___| Settings of the main indicator " RSI Period - averaging period for index calculation (default is 14); RSI Price type - price used for calculations (default is the Close price); "___| Color palette " Text colo
Этот индикатор предназначен для контроля уровней CCI на текущем и старших от него таймфреймах. Панель управления проста в понимании и состоит из кнопок, с помощью которых можно управлять отображением линий, соответствующим указанным на наименовании кнопок. Цвет кнопки совпадает с цветом линии. Этот индикатор из серии подобных индикаторов, которые уже успели завоевать популярность: https://www.mql5.com/ru/market/product/30276 и https://www.mql5.com/ru/market/product/30403 Параметры "___| Set
The indicator is similar to https://www.mql5.com/en/market/product/12330 . However, it considers the MQL5 platform features. Peaks and bottoms are calculated based solely on external bars. After a swing is formed, the indicator does not redraw providing opportunities for traders working on horizontal level breakthroughs. Traffic can be reduced by changing the amount of calculated bars in the MinBars variable (default value is 500). All you need is to select the output options, so that you can se
The indicator is based on the two-buffer scheme and does not require any additional settings. It can be used on any financial instrument without any restrictions. The indicator is a known ZigZag, but it does not redraw . The indicator allows to easily detect significant levels on the price chart, as well as demonstrates the ability to determine the probable direction of a price movement. The calculations are based on the candles' Close prices, thus improving the reliability of the levels. Para
It is an analogue of the indicator of levels at https://www.mql5.com/en/market/product/24273 for the MetaTrader 5 platform. The indicator shows the levels of the past month, week and day. In addition, it draws a level in percentage relative to the difference between the High and Low of the past month and week. For the daily levels of the past day, the Close levels are additionally displayed. All you need to do is to configure the display parameters of the levels to your liking. In some cases, af
Filtro:
Snova
164
Snova 2019.09.28 02:54 
 

L'utente non ha lasciato alcun commento sulla valutazione.

Chris Mukengeshayi
1733
Chris Mukengeshayi 2019.02.01 13:56 
 

L'utente non ha lasciato alcun commento sulla valutazione.

Matthew Todorovski
12938
Matthew Todorovski 2018.06.12 16:07 
 

L'utente non ha lasciato alcun commento sulla valutazione.

Rispondi alla recensione
Versione 1.1 2018.03.23
v1.1
1. The lines are placed automatically at the first start of the indicator.
2. Added automatic selection of lines at restarts.