
Purtroppo, "Currency Relative Strength Digit" non è disponibile
Puoi consultare altri prodotti di Ziheng Zhuang:
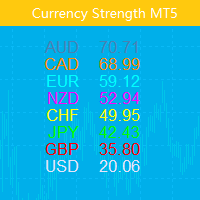
Questo indicatore mostra la forza relativa delle otto principali valute (USD, EUR, GBP, AUD, NZD, CAD, CHF, JPY). I valori della forza sono normalizzati nell'intervallo da 0 a 100. Un valore maggiore di 60 significa forte. Un numero inferiore a 40 indica debolezza.
biglietto Only Show Current Pair - Se vero, viene visualizzata solo la coppia di carte corrente. Altrimenti verranno visualizzate tutte le otto curve. Bars To Show – Numero di barre per visualizzare la curva di forza

L'indicatore comprende due parti. Parte I: Le candele colorate mostrano la tendenza principale Le candele colorate servono a identificare lo stato del mercato tramite candele colorate. Come mostrato negli screenshot, se il colore è Acqua, il mercato è in uno stato in cui dovresti piazzare ordini lunghi o uscire da ordini corti. Se il colore è Pomodoro, è il momento di effettuare ordini brevi o di uscire da ordini lunghi. Se il colore sta cambiando, è meglio attendere il suo completamento (fino a

This indcator shows the trend with the color histogram. It is simple and easy to use. Usage: If the histogram changes from the aqua to the fuchsia, which means the trend is up. If the histogram changes from the fuchsia to the aqua,which means the trend is down. Inputs: MaPeriods: the periods of moving average. f1: the multiplier of inner bands f2: the multiplier of outer bands Popup Window Alert Email Alert Mobile Push Alert Alerts When the trend changes from the long trend to the short trend or

This Expert Advisor is designed to manage orders. It offers the following functions: Set a stop loss for an order having none. Set a take profit for an order having none. Close the last order if the total orders of a symbol are over the setting. Close the order if its lots are over the setting. Close the order if its profit in pips is over the setting. Close the order if its loss in pips is over the setting. Close the order if its profit in amount is over the setting. Close the order if its loss
FREE
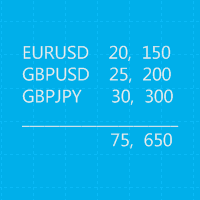
This is a MetaTrader 5 script. It helps to summarize all trades into every symbol.
Input Select Period: This is 7-option input. It includes Last Month, This Month, Last Week, This Week, Today, All History, and Date Specified. Specify Starting Date: Enter a date if you selected Date Specified in "Select Period" input. Specify Ending Date: Enter a date if you selected Date Specified in "Select Period" input. The summary is saved into a file in MQL5\Files folder. MT4 Version: https://www.mql5.c
FREE

This EA is designed to monitor the slippage of opening and closing orders, and save the records in files. It is useful to record the slippage and evaluate brokers. The record files are saved in the folder MT4_Data_Folder\MQL4\Files. Go to "File " --> "Open Data Folder" . Warning : Do NOT open the files directly, otherwise it will affect the exectution of EA, just copy them to another folder and open them.
Usage: Open a chart and load the EA on it, just need only one EA to run, it monitors a
FREE

This EA is designed to monitor the slippage of opening and closing orders, and save the records in csv file. It is useful to record the slippage and evaluate brokers. The record files are saved in the folder MT5_Data_Folder\MQL5\Files. Go to "File " --> "Open Data Folder" . Warning : Do NOT open the files directly, otherwise it will affect the exectution of EA, just copy them to another folder and open them.
Usage: Open a chart and load the EA on it, just need only one EA to run, it m
FREE
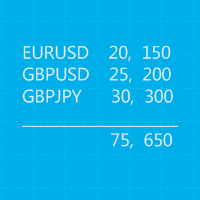
This is a MetaTrader 4 script. It helps to summarize all trades into every symbol.
Input Select Period: This is 7-option input. It includes Last Month, This Month, Last Week, This Week, Today, All History, and Date Specified. Specify Starting Date: Enter a date if you selected Date Specified in "Select Period" input. Specify Ending Date: Enter a date if you selected Date Specified in "Select Period" input. The summary is saved into a file in MQL4\Files folder. Also, there is pop-up window for
FREE
This is a MetaTrader 4 script. It helps to export all trades into a CSV file as per Symbol and selected periods.
Input Select Symbol: This is 2-option input. Select current symbol or all symbols to export its orders. Select Period: This is 7-option input. It includes Last Month, This Month, Last Week, This Week, Today, All History, and Date Specified. Specify Starting Date: Enter a date if you selected Date Specified in "Select Period" input. Specify Ending Date: Enter a date if you selected D
FREE

Questo consulente offre le seguenti funzionalità: Posizione aperta: apri un ordine lungo o corto quando il prezzo attraversa la linea di tendenza. Liquidazione: liquida le posizioni lunghe o corte quando il prezzo attraversa la linea di tendenza. Trailing Stop Loss – L'EA segue la linea di tendenza e continua ad aumentare lo stop loss per gli ordini a lungo termine o a ridurre lo stop loss per gli ordini a breve termine. La linea può essere una linea di tendenza o una linea orizzontale. Le

L'indicateur comprend deux parties. Partie I : Les bougies colorées montrent la grande tendance Les bougies de couleur consistent à identifier l'état du marché à l'aide de chandeliers de couleur. Comme le montrent les captures d'écran, si la couleur est Aqua, le marché est dans un état dans lequel vous devez passer des ordres longs ou quitter des ordres courts. Si la couleur est Tomate, c'est le moment de passer des commandes courtes ou de sortir des commandes longues. Si la couleur change, il v
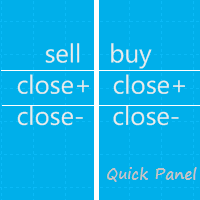
Questo panel è composto da consulenti esperti e offre sei gruppi di panel di trading. Versione MT5: copertura rapida del pannello
caratteristiche La maggior parte delle operazioni di trading possono essere eseguite rapidamente facendo clic sui pulsanti su questo pannello. Cambiare i pannelli è facile come fare clic sul pulsante verde. EA può essere eseguito sui grafici visivi di Strategy Tester e fornisce un modo semplice per esercitarsi nel trading basato su dati storici. Modifica lo stop l
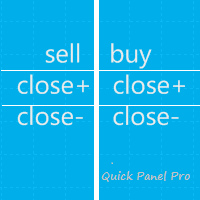
Questo EA è uno strumento di trading professionale che integra una gestione flessibile del rischio e 6 set di pannelli di trading. Versione MT5: Quick Panel Hedging caratteristiche I calcoli batch sono rapidi e semplici. Quando si sposta la linea di arresto, i calcoli vengono eseguiti immediatamente. La maggior parte delle transazioni commerciali può essere completata rapidamente semplicemente facendo clic su questo pannello. Puoi passare rapidamente da un pannello all'altro semplicemente face
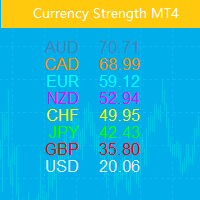
Questo indicatore mostra la forza relativa delle otto principali valute (USD, EUR, GBP, AUD, NZD, CAD, CHF, JPY). I valori della forza sono normalizzati nell'intervallo da 0 a 100. Un valore maggiore di 60 significa forte. Un numero inferiore a 40 indica debolezza. Il principio fondamentale Date otto valute, USD, EUR, GBP, AUD, NZD, CAD, CHF, JPY, dove ciascuna coppia di due può essere combinata, per un totale di 28 coppie, viene utilizzato un algoritmo inverso per estrarre la forza delle otto v

This indicator shows the main trend on the current chart.
Features This indicator includes two bands, one is the inner white bands, another is the outer blue bands. If the white dotted line crosses down the white solid line, this means that the trend has changed to be bearish. If the white dotted line crosses up the white solid line, this means that the trend has changed to be bullish. Once the crossing happened, it will not repaint.
Settings ShowColorCandle: if 'true', it will show the colo

This indicator shows main trend, entry zone and exit zone. This is a muti-timeframe indicator, so it is always repainting in the current period of the higher timeframe.
Features Colorful Histogram: it indicates the main trend, the tomato means the market is bearish,and the sky blue means the market is bullish. Inner Blue Bands: it is entry zone for entry market, the market is relatively safe for entry. Outer Yellow Bands: it is exit zone for exit market, the market is oversold or overbought.
Questo consulente è una dashboard che ti consente di scambiare più coppie con un solo clic. Clicca su aprire Questo pulsante apre un ordine per la coppia selezionata. Clicca su chiudere Questo pulsante chiude l'ordine per la coppia selezionata. Il lotto dell'ordine è il numero inserito dall'utente. I numeri positivi corrispondono agli ordini di acquisto, mentre i numeri negativi corrispondono agli ordini di vendita. Fare clic sul pulsante Chiudi per chiudere l'intero

This indicator is designed to show the pair power of the major 28 paris with RSI,Stochostic,and CCI. The power value is sorted from the weak to the strong. The weaker pairs: the pairs occurs at least 2 times in the top 3 rows The stronger pairs: the pairs occurs at least 2 times in the bottom 3 rows Users can add another symbol, so it can calculate 28+1 symbols. My advice: https://www.mql5.com/en/blogs/post/729880
A free EA with Pair Power Matrix --- https://www.mql5.com/en/blogs/post/732

The purpose of the inidcator is to identify the reversal point.
The blue arrow is buy signal and the yellow star is its stop loss. The red arrow is sell signal and the yellow star is its stop loss. Alert feature: if there is a signal, the indicator will send alerts of popup window,email or mobile push. Inputs: Popup Window Alert: it is false in default Email Alert : it is false in default Mobile Push Alert: it is false in default. MetaTrader 5 Version: Reversal Point Please note that the singa
orologio. Questo consiglio riguarda solo la copertura dell'account. Versione Meta Trader 4 Quick Panel Pro
caratteristiche I calcoli batch sono rapidi e semplici. Quando si sposta la linea di arresto, i calcoli vengono eseguiti immediatamente. La maggior parte delle transazioni commerciali può essere completata rapidamente semplicemente facendo clic su questo pannello. Puoi passare rapidamente da un pannello all'altro semplicemente facendo clic sui pulsanti verdi. Modifica lo stop los
Nota: questo EA funziona solo su account privi di rischio. Versione Metatrader 4 pannello rapido Questo panel è un gruppo di sei consulenti esperti che costituiscono un panel di negoziazione.
caratteristiche La maggior parte delle attività di trading può essere completata rapidamente facendo clic sui pulsanti su questi pannelli. Passare da un pannello all'altro è facile come fare clic sul pulsante verde. EA può essere eseguito sui grafici visivi di Strategy Tester e fornisce un modo sem

Gamma Bands This indcator shows the trend with the color histogram. It is simple and easy to use. Usage: If the histogram changes from the aqua to the fuchsia, which means the trend is up. If the histogram changes from the fuchsia to the aqua,which means the trend is down. Inputs: MaPeriods: the periods of moving average. f1: the multiplier of inner bands f2: the multiplier of outer bands Popup Window Alert Email Alert Mobile Push Alert Alerts When the trend changes for the long trend to the

The purpose of the inidcator is to identify the reversal point.
The blue arrow is buy signal and the yellow star is its stop loss. The red arrow is sell signal and the yellow star is its stop loss. Please note that the singal is against trend,it could be continual fail. Alert feature: if there is a signal, the indicator will send alerts of popup window,email or mobile push. Inputs: Popup Window Alert: it is false in default Email Alert : it is false in default Mobile Push Alert: it is false in

Questo consulente offre le seguenti funzionalità: Posizione aperta: apri un ordine lungo o corto quando il prezzo attraversa la linea di tendenza. Liquidazione: liquida le posizioni lunghe o corte quando il prezzo attraversa la linea di tendenza. Trailing Stop Loss – L'EA segue la linea di tendenza e continua ad aumentare lo stop loss per gli ordini a lungo termine o a ridurre lo stop loss per gli ordini a breve termine. La linea può essere una linea di tendenza o una linea orizzontale. Le
Questo consulente è una dashboard che ti consente di scambiare più coppie con un solo clic. Clicca su aprire Questo pulsante apre un ordine per la coppia selezionata. Clicca su chiudere Questo pulsante chiude l'ordine per la coppia selezionata. Il lotto dell'ordine è il numero inserito dall'utente. I numeri positivi corrispondono agli ordini di acquisto, mentre i numeri negativi corrispondono agli ordini di vendita. Fare clic sul pulsante Chiudi per chiudere l'intero