LRS Lineal Regresion Slope
- Indicatori
- Jose Miguel Soriano
- Versione: 2.10
- Aggiornato: 22 gennaio 2022
- Attivazioni: 5
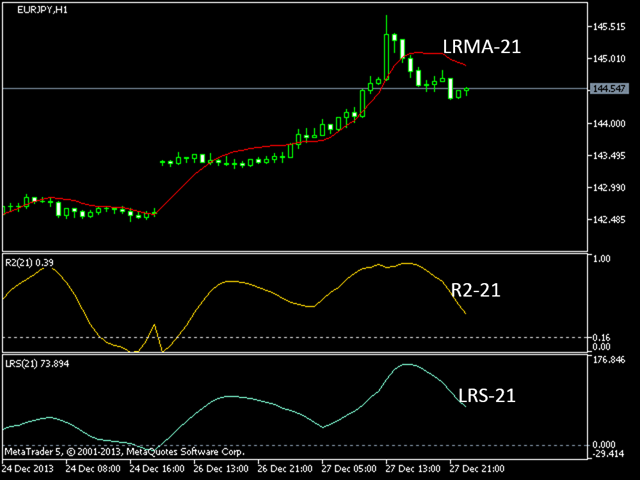
If instead of giving the regression value indicator end of the regression line (LRMA), we give the value of its slope, we obtain LRS or Linear Regression Slope Indicator.
Since the slope is positive when prices rise, zero when they are in range and negative when they are lowered, LRS provides us the data on the price trend.
Calculation
                      sum(XY, n) - avg(Y, n)*sum(X, n)
  Y= a + mX;      m=  --------------------------------        a= avg(Y, n) - m*avg(X, n)
                      sum(X2, n) - avg(X, n)*sum(X, n)
According to the above formulas, the moving average of "Y" values builds the LRMA indicator; the moving average of "m" values builds the LRS indicator.
The usefulness of this indicator increases when it is used with the R-squared indicator that reports the strength of the trend, while LRS informs us of the positive or negative strength.
