Multi Price Line Indicator
- Indicatori
- Aleksey Zinovik
- Versione: 1.0
- Attivazioni: 5
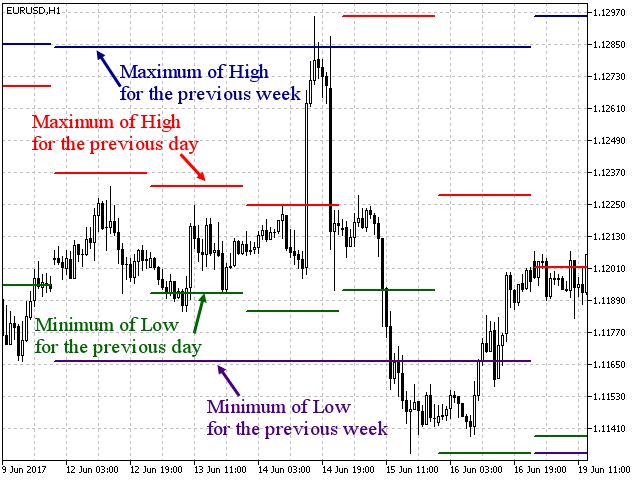
The indicator displays the price lines calculated based on the prices for the previous period. The lines can be used by traders as the support and resistance levels, as well as for determining the market entry or exit points, partial profit taking points.
A distinct feature of the indicator is the ability to display up to six different price levels, which allows showing the support and resistance lines based on different periods on the same chart. For example, it is possible to show the Highs and Lows of the previous day, week, month on the chart.
The following parameters can be adjusted for each price line:
- TypeOfLine - line type: high, low, open or close;
- ValueOfLine - line value: maximum value (the maximum price value for the previous period), minimum value (the minimum price value for the previous period), average value (the average price value for the previous period);
- TimeframeOfLine - line period: must be a multiple of the current chart period;
- VisibleOfLine - line visibility: true (show the line), false (hide the line);
- DBegin - date to start the display;
- DEnd - date to stop the display.


