Plotter
- Indicatori
- Daniel Sic
- Versione: 3.20
- Attivazioni: 5
Plotter is an indicator that was created during the ICT mentorship to make charting quick, easy and fun for everybody.
Assign a function to any hotkey in indicator settings or use the default keys to perform smart actions that usually takes a lot of time to perform.
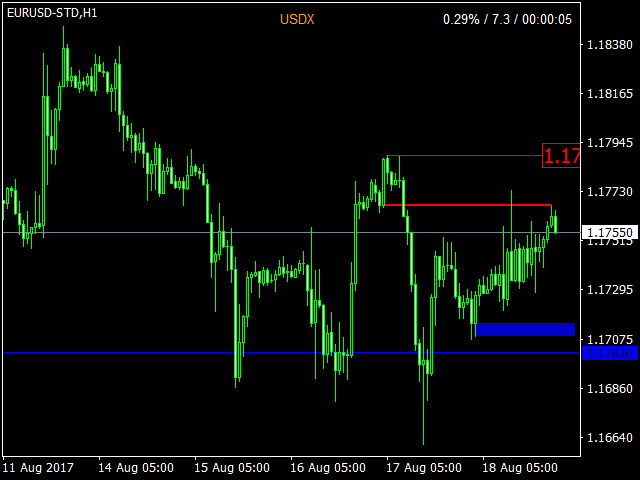
Click on any bar, press OHLCMBVPOKJH to plot objects, color them with keys 0-9 or modify them with keys ERAZ and much much more.
Indicator settings are described below.
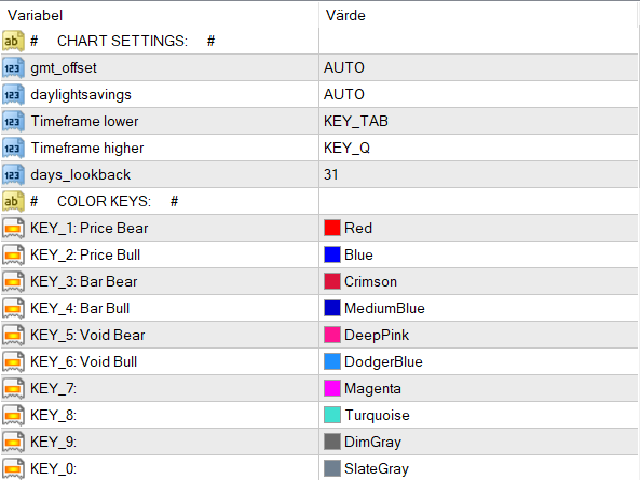
CHART SETTINGS
- gmt_offset
- auto
- -23 - 23
- daylightsavings= set dst
- TIMEFRAME_DOWN= set key to change timeframe lower
- TIMEFRAME_UP= set key to change timeframe higher
- days_lookback= limit indicator drawing in history (days)
COLOR KEYS
- color1= choose color for KEY_1
- color2= choose color for KEY_2
- color3= choose color for KEY_3
- color4= choose color for KEY_4
- color5= choose color for KEY_5
- color6= choose color for KEY_6
- color7= choose color for KEY_7
- color8= choose color for KEY_8
- color9= choose color for KEY_9
- color0= choose color for KEY_0
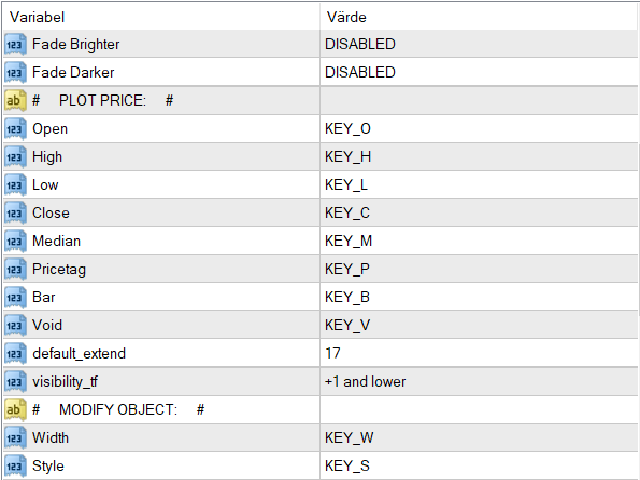
- DARKER= set key to Fade Brighter
- BRIGHTER= set key to Fade Darker
PLOT PRICE, click on any bar and press keys to plot prices
- OPEN= set key, Open price
- HIGH= set key, High price
- LOW= set key, Low price
- CLOSE= set key, Close price
- MEDIAN= set key, Median price
- PRICETAG= set key, Pricetag
- BAR= set key, rectangle Bar
- VOID= set key, rectangle Void
- default_extend= limit how many bars into future to draw PricePlots
- visibility_tf= set timeframe visibility for PricePlots
MODIFY OBJECT, click on object and press key to modify
- WIDTH= set key
- STYLE= set key
- EXTEND= set key
- REDUCE= set key
- HIGHER= set key
- LOWER= set key
- HLTL= set key, toggle between Horizontal / Trendline
- NEAREST= round object to nearest 5 pips
CHART OVERLAY
- overlay_symbol= set default symbol ex. "USDX"
- OVERLAY= enable/disable Overlay
- FLIP= flip it
- suffix= set symbol suffix
- overlay_price
- overlay_color
- overlay_width
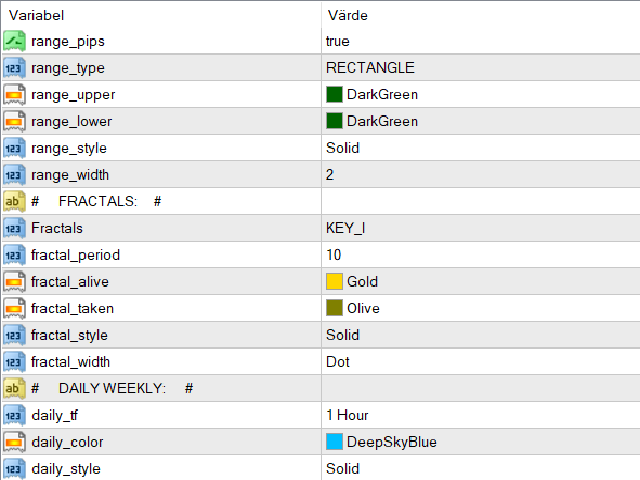
PROJECTIONS, asia range / central bank dealers range / flout
- RANGES= toggle ranges
- PROJECTIONS= show range projections
- range_pips= how pips
- range_type
- line style
- reqtangle style
- range_upper= choose color
- range_lower= choose color
- range_style
- range_width
FRACTALS
- FRACTALS= enable/disable fractals
- fractal_period= set period
- fractal_alive= set color, non traded
- fractal_taken= set color, traded
- fractal_style
- fractal_width
DAILY WEEKLY, levels
- daily_tf= limit display timeframe (up to)
- daily_color
- daily_style
- daily_width= set 0 to disable level
- daily_start= start hour
- daily_length= in hours
- weekly_tf= limit display timeframe (up to)
- weekly_color
- weekly_style
- weekly_width= set 0 to disable
- weekly_start= start hour
- weekly_length= in hours
MARKET HOURS, session boxes
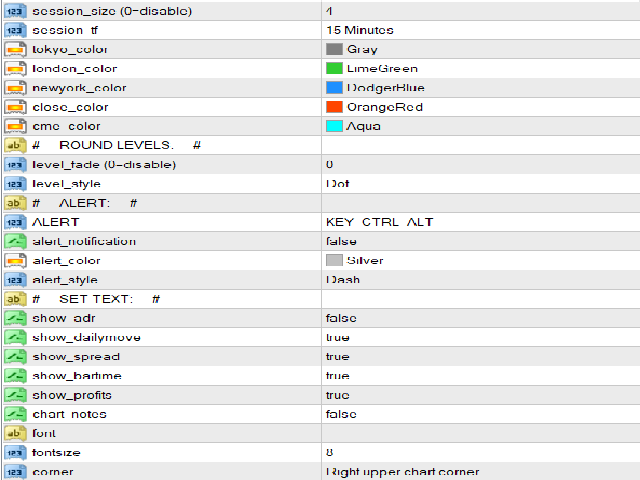
- session_size= box size, set 0 to disable
- session_tf= limit display timeframe (up to)
- tokyo_color
- london_color
- newyork_color
- close_color
- cme_color
ROUND LEVELS, auto corrective grid
- level_fade= color is based of your background, set 0 to disable
- level_style
ALERT, click on chart and press hotkey to set alert
- ALERT= set key
- alert_notification= send email
- alert_color
- alert_style
SET TEXT
- show_adr= enable/disable
- show_dailymove= enable/disable
- show_spread= enable/disable
- show_bartime= enable/disable
- show_profits= enable/disable, show market order profits
- chart_notes= enable/disable, note box
- font= "" is default
- fontsize
- corner
