Three Bar Break
- Indicatori
- Stephen Reynolds
- Versione: 1.0
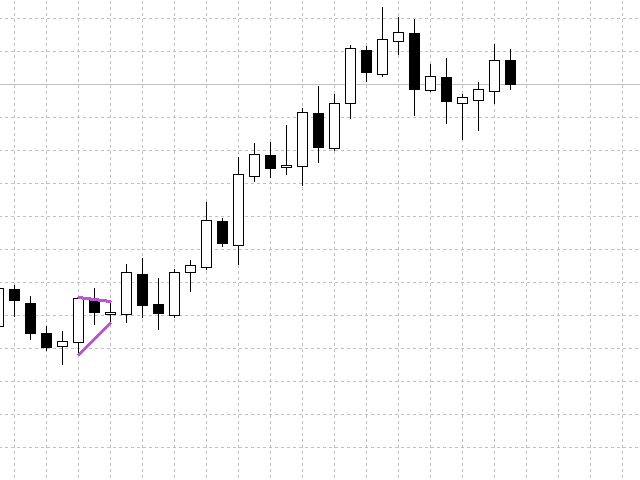
Three Bar Break is based on one of Linda Bradford Raschke's trading methods that I have noticed is good at spotting potential future price volatility. It looks for when the 1st bar's High is less than the 3rd bar's High as well as the 1st bar's Low to be higher than the 3rd bar's Low. This then predicts the market might breakout to new levels within 2-3 of the next coming bars.
It should be used mainly on the daily chart to help spot potential moves in the coming days.
Features :
- A simple method of predicting future volatility.
- Choose your favourite Line colors and sizes.
- Send alerts to either your PC, eMail or mobile device.
Settings :
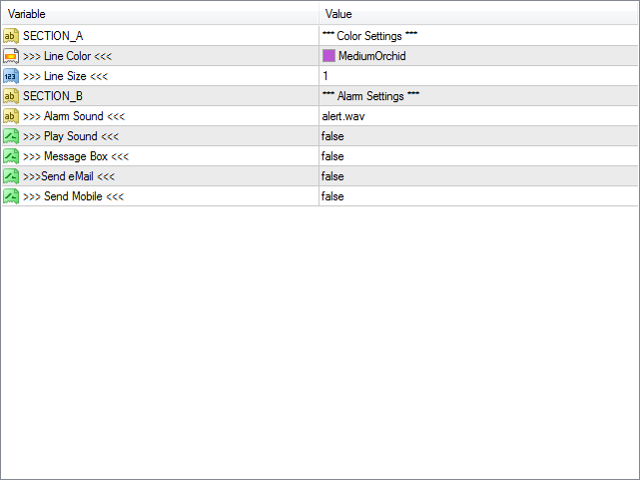
Color Settings
- Line Color - Choose the line color of the 3 bar formation.
- Line Size - Choose the line size of the 3 bar formation.
Alert Settings
- Soundfile - which wave file sound we use for our PC alarm.
- PlaySound - true means we here our PC alarm, false means we do not hear our PC alarm.
- MessageBox - true means we see a message box, false means we do not see a message box.
- SendeMail - true means we get an alert sent to our email, false means we do not get an alert sent to our email.
- SendMobile - true means we get an alert sent to our mobile device, false means we do not get an alarm sent to out mobile device.


i've tested it only on tester but it looks really good.